Ethereum (ETH) has moved back above key support after a brief breakdown, with the asset recovering toward $4,150. The move comes after a 24-hour gain of over 8%, though ETH remains down more than 8% over the past week.
Pattern Repeats After False Breakdown
A chart shared by Trader Tardigrade outlines a recurring price pattern: a false breakdown, followed by a reclaim of support, and then a rally.
$ETH/daily#Ethereum has reclaimed above the previous low, which was marked as a support, after a false breakdown.
It’s following this pattern:
False breakdown
Reclaim
Rally
We might see a Rally moving above the previous high soon
pic.twitter.com/BEJTQda0oY
— Trader Tardigrade (@TATrader_Alan) October 13, 2025
The exact sequence has occurred multiple times over the past year. In each case, the breakdown led to a sharp recovery. The most recent setup shows ETH reclaiming the $3,650 zone. The pattern points to a possible move back toward the $4,800 level if momentum continues.
Chart Targets $7,000 by Mid-2026
Investor Mike Investing posted a weekly ETH chart projecting a long-term price target of $7,000 by May 2026. The chart shows ETH trading well above its 200-week moving average, now near $2,447. This level has acted as a base during previous market cycles.
Remarkably, the post claims that during the recent correction, large firms including BlackRock, BitMine, and Vanguard increased their ETH holdings. While this activity isn’t confirmed in public filings, the chart suggests a strong return is possible over the next several months if ETH holds above support.
I’m officially calling it…$ETH had its final hard pullback below $4,000 before it begins its multi month incoming rally.
During the recent pullback institutions like BitMine, Blackrock, & Vanguard all loaded collectively billions in $ETH.
$7000+ by May 2026.
Mark my words… pic.twitter.com/m0xCGA0pb1
— Mike Investing (@MrMikeInvesting) October 12, 2025
In addition, a separate chart from Mister Crypto compares Ethereum’s current structure to its 2016–2017 cycle. The side-by-side view shows that both charts experienced a breakout, followed by a short pullback. In the earlier cycle, this setup led to a steep multi-month rally.
The post claims, “This $ETH setup looks so much like it did in 2017,” placing the current phase just before a major leg up. Traders watching fractals often use these historical patterns as rough guides, but outcomes can vary.
Coinbase Premium Hits Year-High
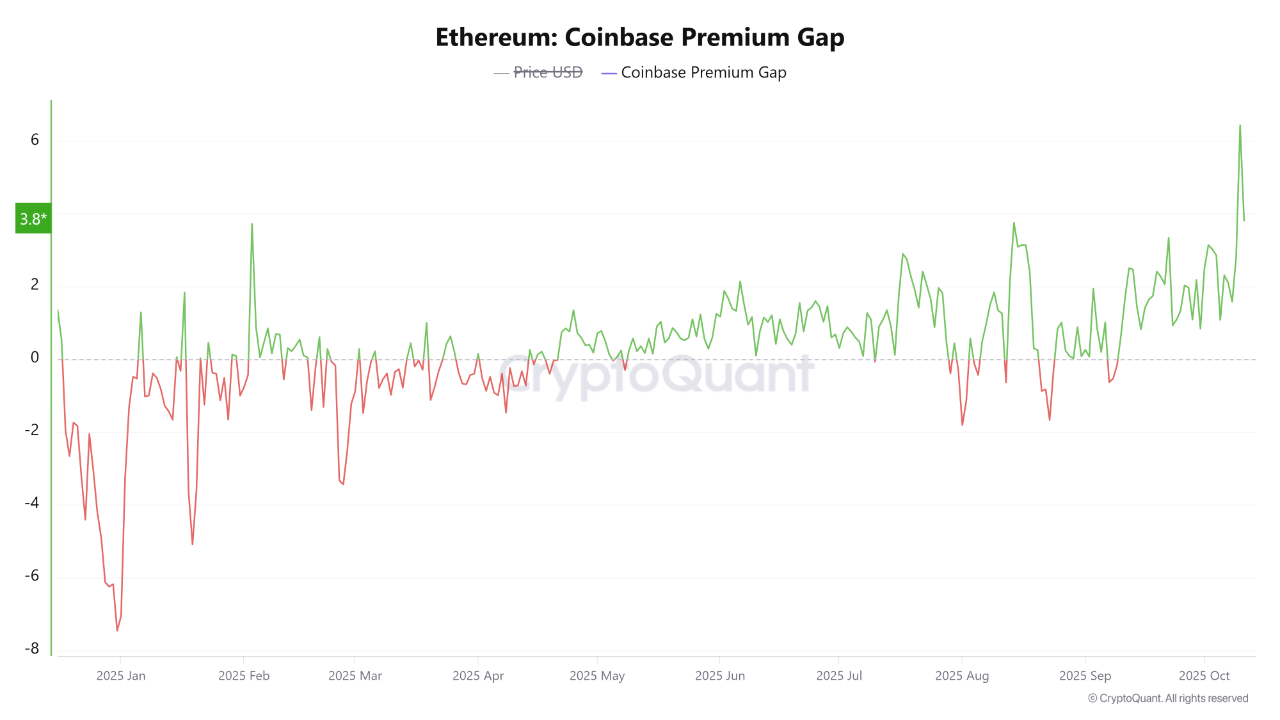
On-chain analyst CryptoOnchain reported a sharp spike in Ethereum’s Coinbase Premium Gap, hitting +6.0 on October 10. This shows ETH was trading much higher on Coinbase than on global exchanges like Binance, often a sign of strong U.S. demand.
“While the global market was selling, an overwhelmingly aggressive wave of buying was taking place on the Coinbase exchange,” the post said.
This kind of buying often reflects institutional interest, especially when it shows up during market corrections.

The data suggests that major investors are positioning during dips, creating a possible floor around current price levels.
The post ETH Chart Flashes Classic Rally Pattern, $4.8K or $7K Next? appeared first on CryptoPotato.
