Bitcoin has staged a recovery from the institutional demand zone near $106K, reclaiming key short-term structure levels. While momentum remains cautious, reclaiming $114K–$116K remains essential to confirm a bullish continuation toward the previous all-time highs.
Technical Analysis
By Shayan
The Daily Chart
On the daily timeframe, Bitcoin has rebounded strongly from the $102K–$104K institutional demand zone, which aligns with both the 200-day MA and the ascending channel support that has guided the broader uptrend since mid-2024.
The recovery candle structure shows early signs of renewed strength, but the 100-day MA, currently positioned around $115K, acts as immediate resistance. This level coincides with the mid-range zone from the recent distribution phase and marks the first critical test for bulls.
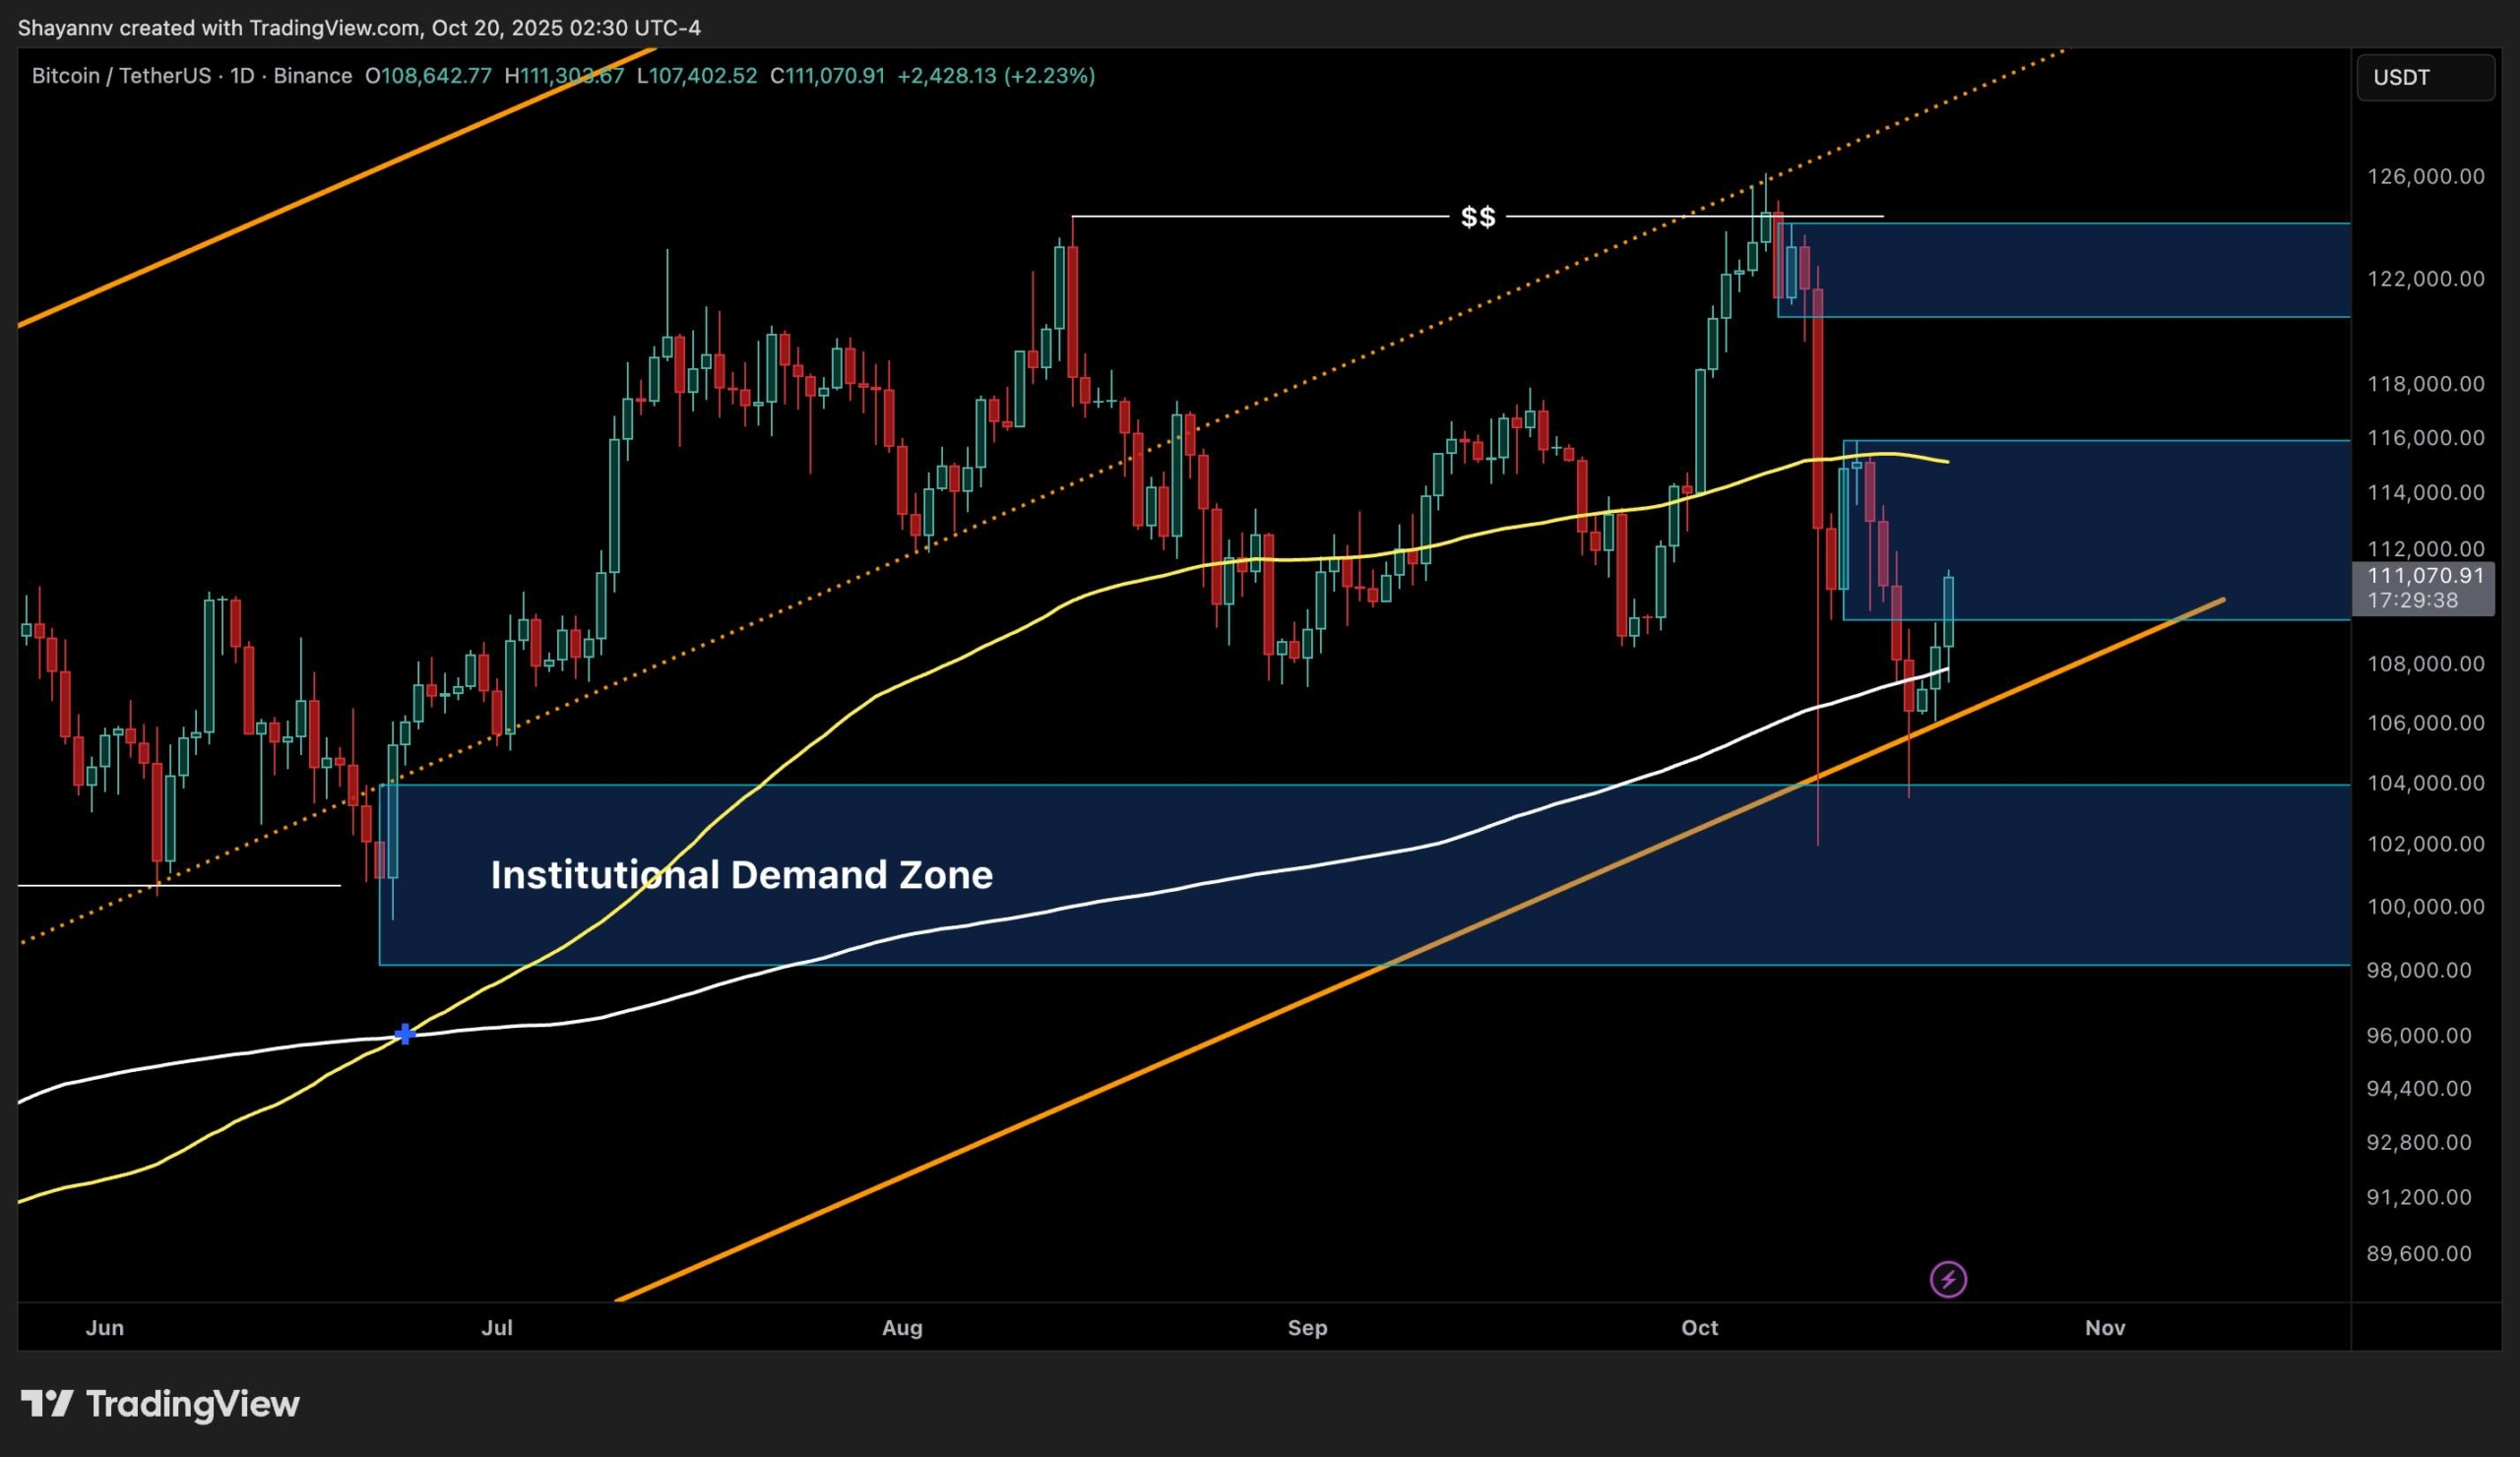
If BTC manages to close above $116K, the path opens for a retest of the $120K–$122K supply zone, followed by the prior $125K all-time high. Conversely, rejection from the moving averages may lead to another retest of the $102K–$104K demand area, which remains a high-liquidity accumulation zone.
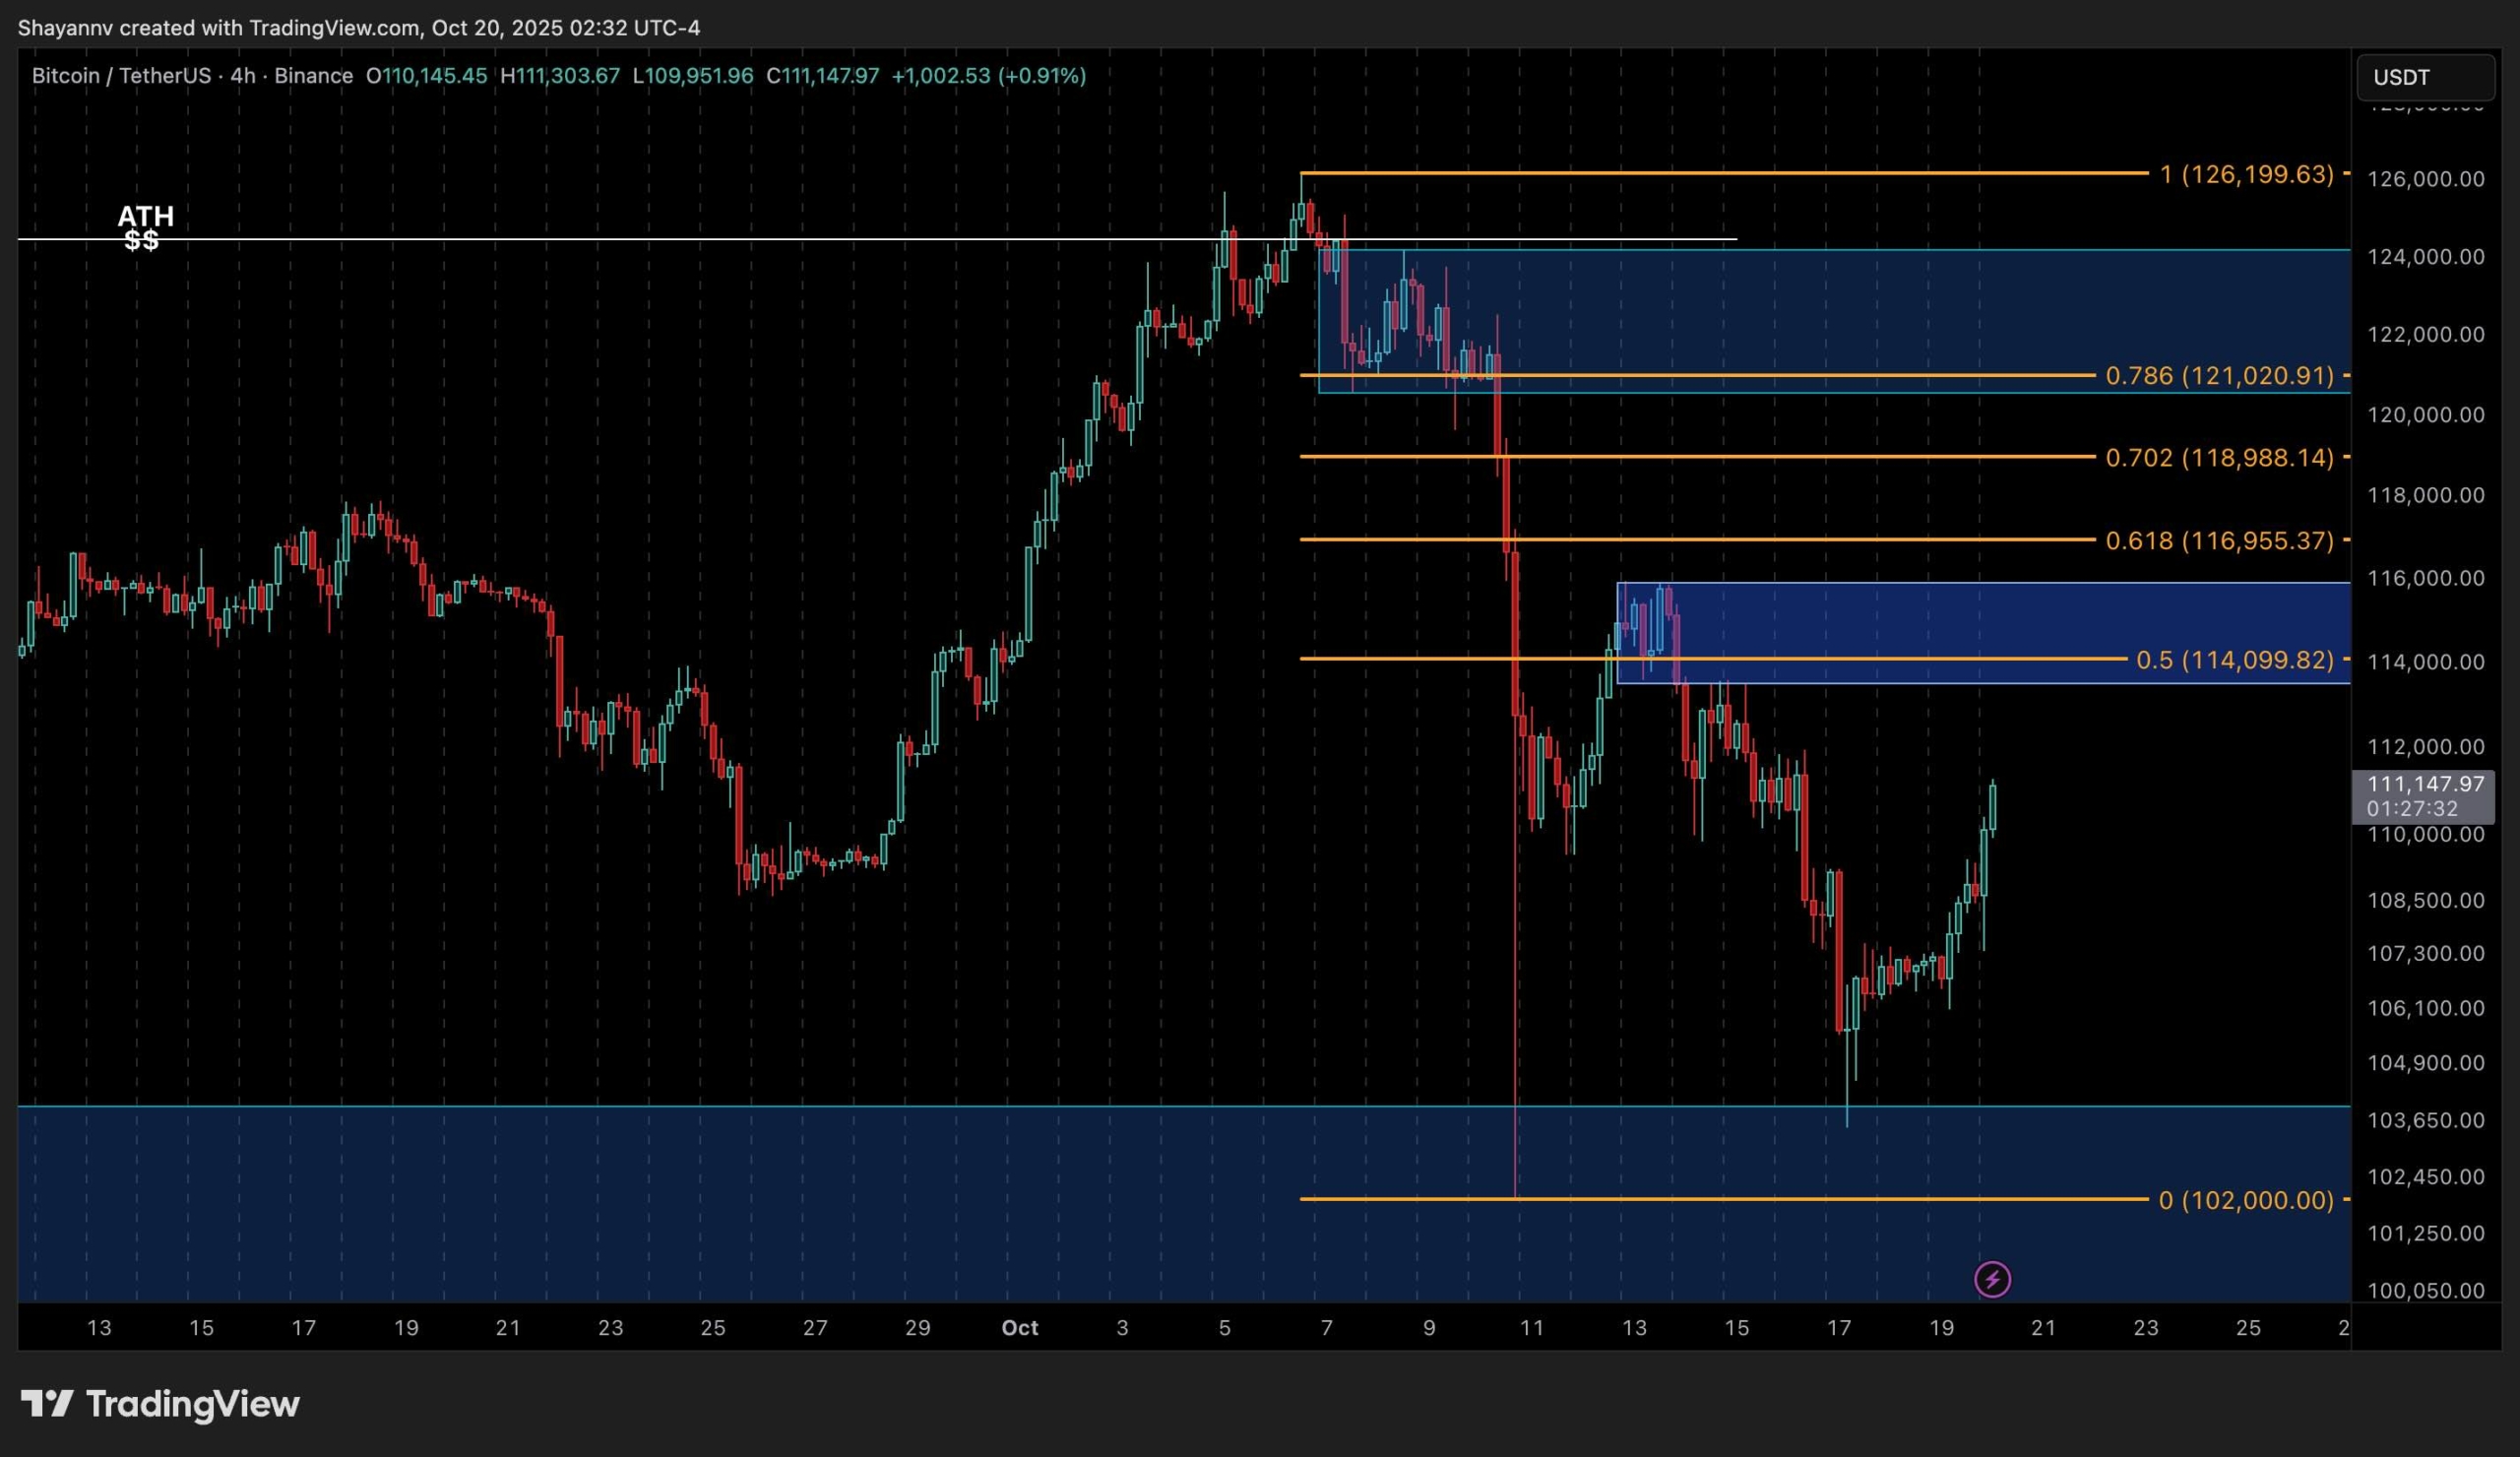
The 4-Hour Chart
The 4-hour structure highlights a textbook retracement rally, with price reclaiming higher lows after a sharp reaction from the $102K–$104K zone. Currently, Bitcoin is consolidating beneath the 0.5–0.618 Fibonacci retracement cluster ($114K–$117K), aligning with the former range base and local order block.
This region acts as a key decision point (DP) for short-term traders. A confirmed breakout above this area would confirm a structural shift in momentum, targeting the $120K–$122K liquidity pocket.
However, if the price fails to reclaim this range and forms another lower high, BTC could revisit the $102K–$104K area to retest demand before establishing a sustainable mid-term base. Momentum remains constructive but fragile, suggesting that volatility compression is setting up for the next directional move.
On-chain Analysis
By ShayanMarkets
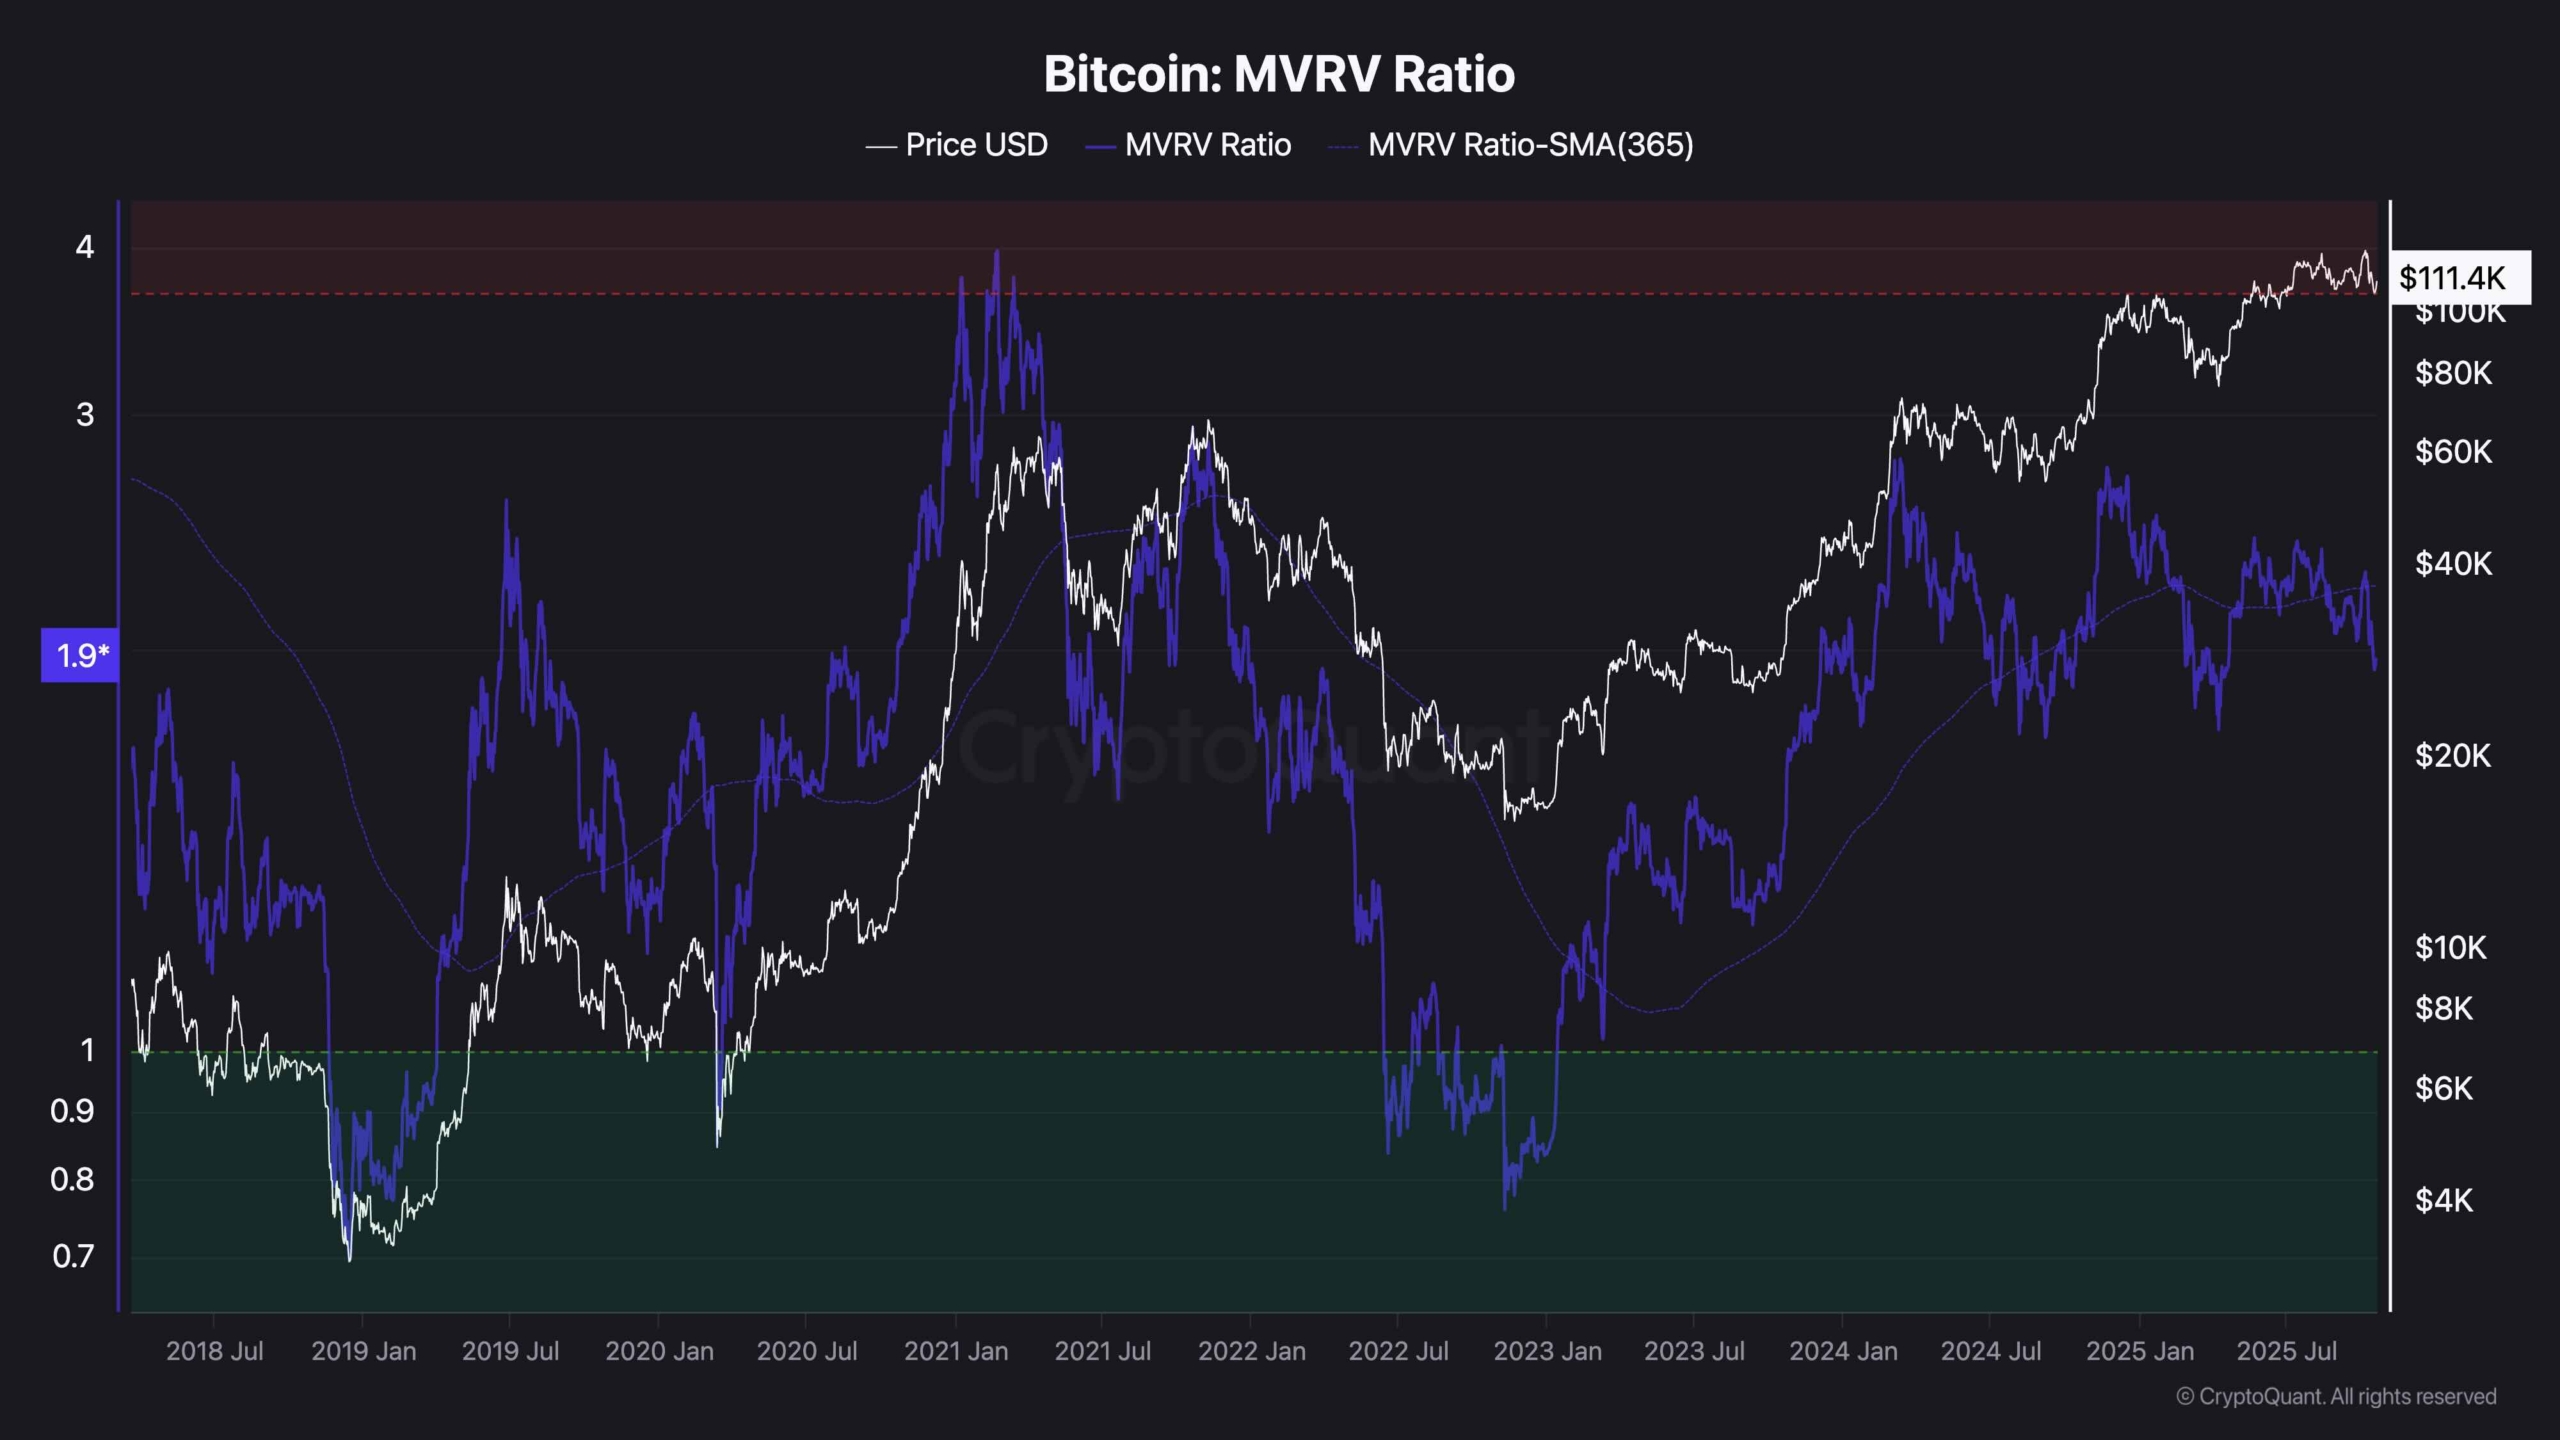
The Bitcoin MVRV Ratio (Market Value to Realized Value) currently stands near 1.9, slightly below its 365-day moving average. Historically, each time the ratio dropped below the 365 SMA, it has marked a buying opportunity and a local bottom signal, as seen during mid-2021, June 2022, and early 2024.
This consistent pattern indicates that the market is once again entering an undervaluation phase, where long-term holders historically begin accumulating. The MVRV Ratio’s positioning below its long-term average reflects reduced speculative excess and growing long-term confidence, aligning with the technical reaction from the institutional demand zone.
If this metric begins to turn upward from current levels, it could confirm that the recent sell-off was a cyclical bottom formation, supporting a renewed bullish phase into Q4.
The post BTC Price Analysis: Bitcoin Needs to Reclaim $114K to Confirm Bull Run Continuation appeared first on CryptoPotato.