Bitcoin’s recent bounce has pushed the market back toward the $70K–$72K area, but the broader structure remains fragile. The key question now is whether this rebound can evolve into a deeper corrective move toward overhead resistance, or if it is merely a temporary reaction within a dominant downtrend.
Bitcoin Price Analysis: The Daily Chart
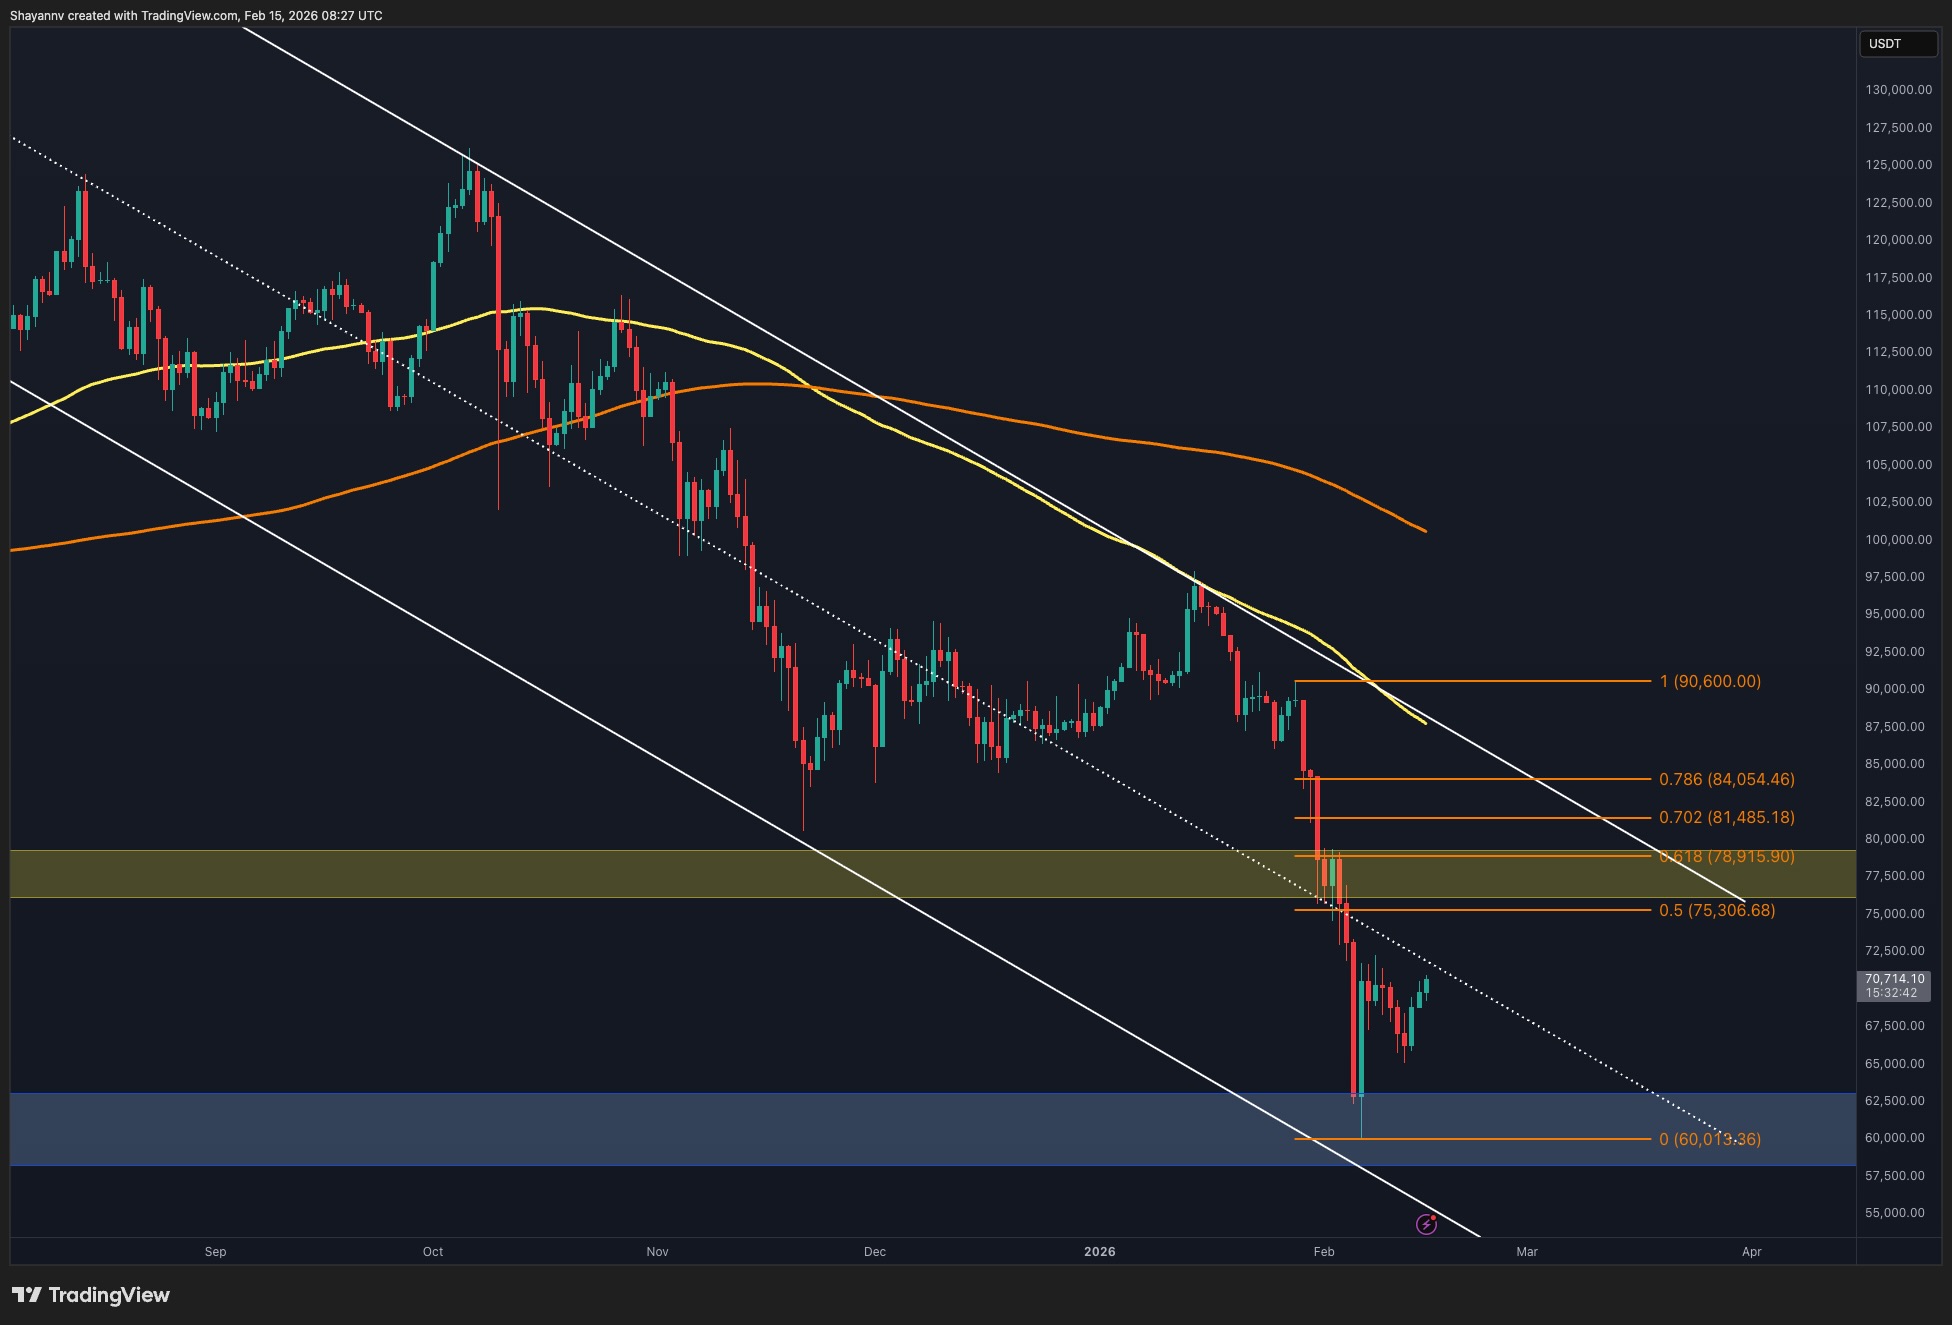
On the daily timeframe, BTC remains inside a clear descending channel, preserving the overall bearish structure. The breakdown below the $75K level triggered an accelerated sell-off that extended directly into the $60K demand zone, where buyers finally stepped in.
The recent recovery has brought the price back toward $70K, which also aligns with the channel’s mid-boundary, making it a notable resistance. However, Bitcoin is still trading below the critical $75K resistance. As long as the market remains beneath the $75K-$80K region, the move is technically considered a corrective rebound within a broader bearish trend.
A decisive reclaim of $75K would expose $78,915 and then $81,485 (0.702) as the next upside targets. On the downside, the $60K zone remains the primary structural support.
BTC/USDT 4-Hour Chart
On the 4-hour timeframe, the rebound from $60K appears impulsive, but the price is now approaching the $70K-$72K short-term resistance area, which aligns with the descending structure and previous breakdown region. The market is currently compressing below this level.
A confirmed break and consolidation above $72K would likely trigger continuation toward $75K crucial threshold. However, failure to clear this resistance could result in renewed downside pressure, targeting $65K first and potentially revisiting the $60K demand zone if selling momentum increases.

Sentiment Analysis
The Bitcoin Futures Average Order Size chart reveals a notable shift during the recent decline. As the asset approached the $60,000–$65,000 region, several green dots appeared, representing large whale-sized orders entering the market. This cluster of green dots near the local bottom suggests that larger participants began accumulating during the panic-driven sell-off.
However, red dots has been apeared following the recent rebou, reflecting retail-driven activity. The recent whale participation at lower prices increases the probability that the $60K region attracted strategic accumulation rather than random buying, while the retail-driven rebound hints at a potential consolidation stage followed by bullish retracements.
If this whale activity returns around the $65K-$80K range, it strengthens the case for a sustained rebound. However, for the structure to shift meaningfully bullish, Bitcoin must reclaim $80K. Without that reclaim, the broader daily trend remains corrective within a bearish framework.

The post Bitcoin Price Analysis: What Does the Latest Rejection at $70K Mean for BTC’s Structure? appeared first on CryptoPotato.