BTC managed to close back above the critical 200-day moving average, boosting near-term technical momentum, driven by strong spot buying.
The price pushed above a declining channel, signaling a near-term breakout to the upside. The 4-hour bullish divergence from the past few days gave an early signal of a potential bottom at $42.8k. Near term, it is very important for BTC to hold the 200-day moving average as support and reclaim $47.2k, a technical and on-chain level of resistance.
Golden Cross on the Daily Chart
The well-known golden cross has occurred, where the 50-day moving average crosses above the 200-day moving average. This is a classic technical signal of further upside. Although bullish, we have to wait for validation because this signal is not the most reliable when it comes to predicting BTC price action.
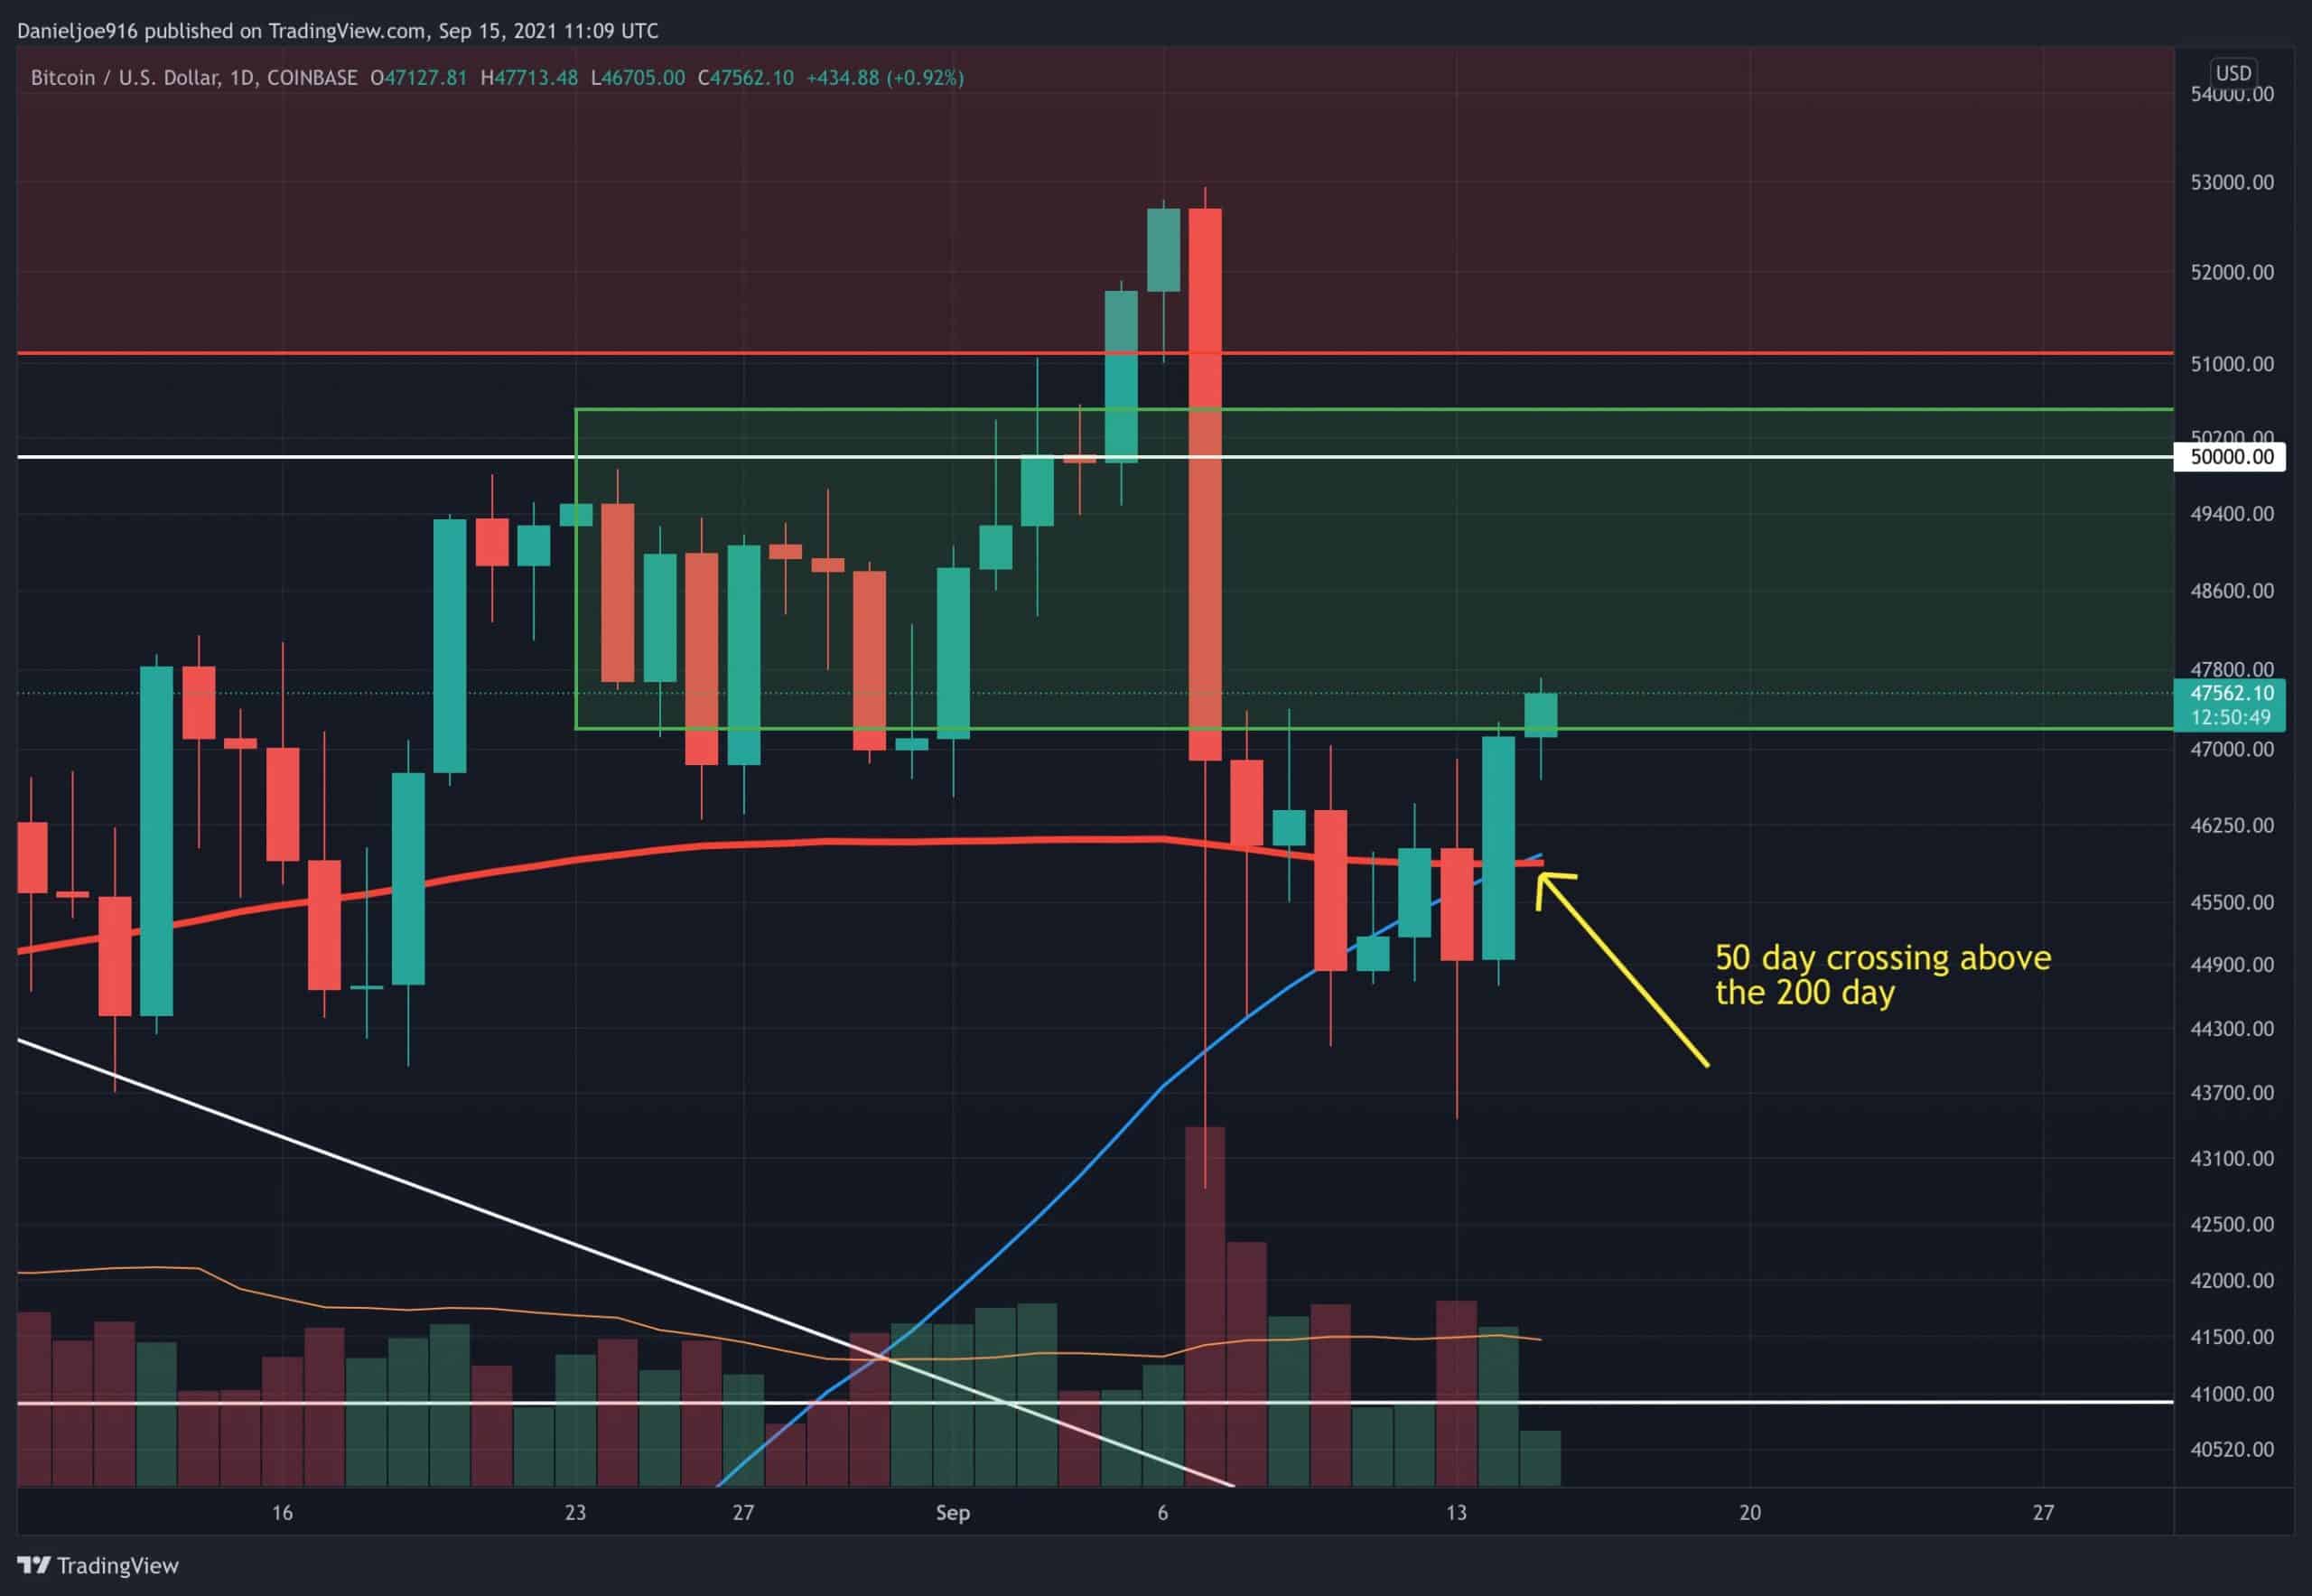
Ideally, the BTC bulls need to see the price push higher in the next few weeks to validate the golden cross.
Key Support Zone Tested
The huge leverage liquidation to $42.8k tested multiple highly confluent support levels and so far, BTC has held support on a closing basis. These confluent levels include a rising trend line connecting the higher highs made since June 2021 at $43.3k, the 21-day moving average on the 3-day chart at $43.7k, and the 21-week exponential moving average at $43.5k.
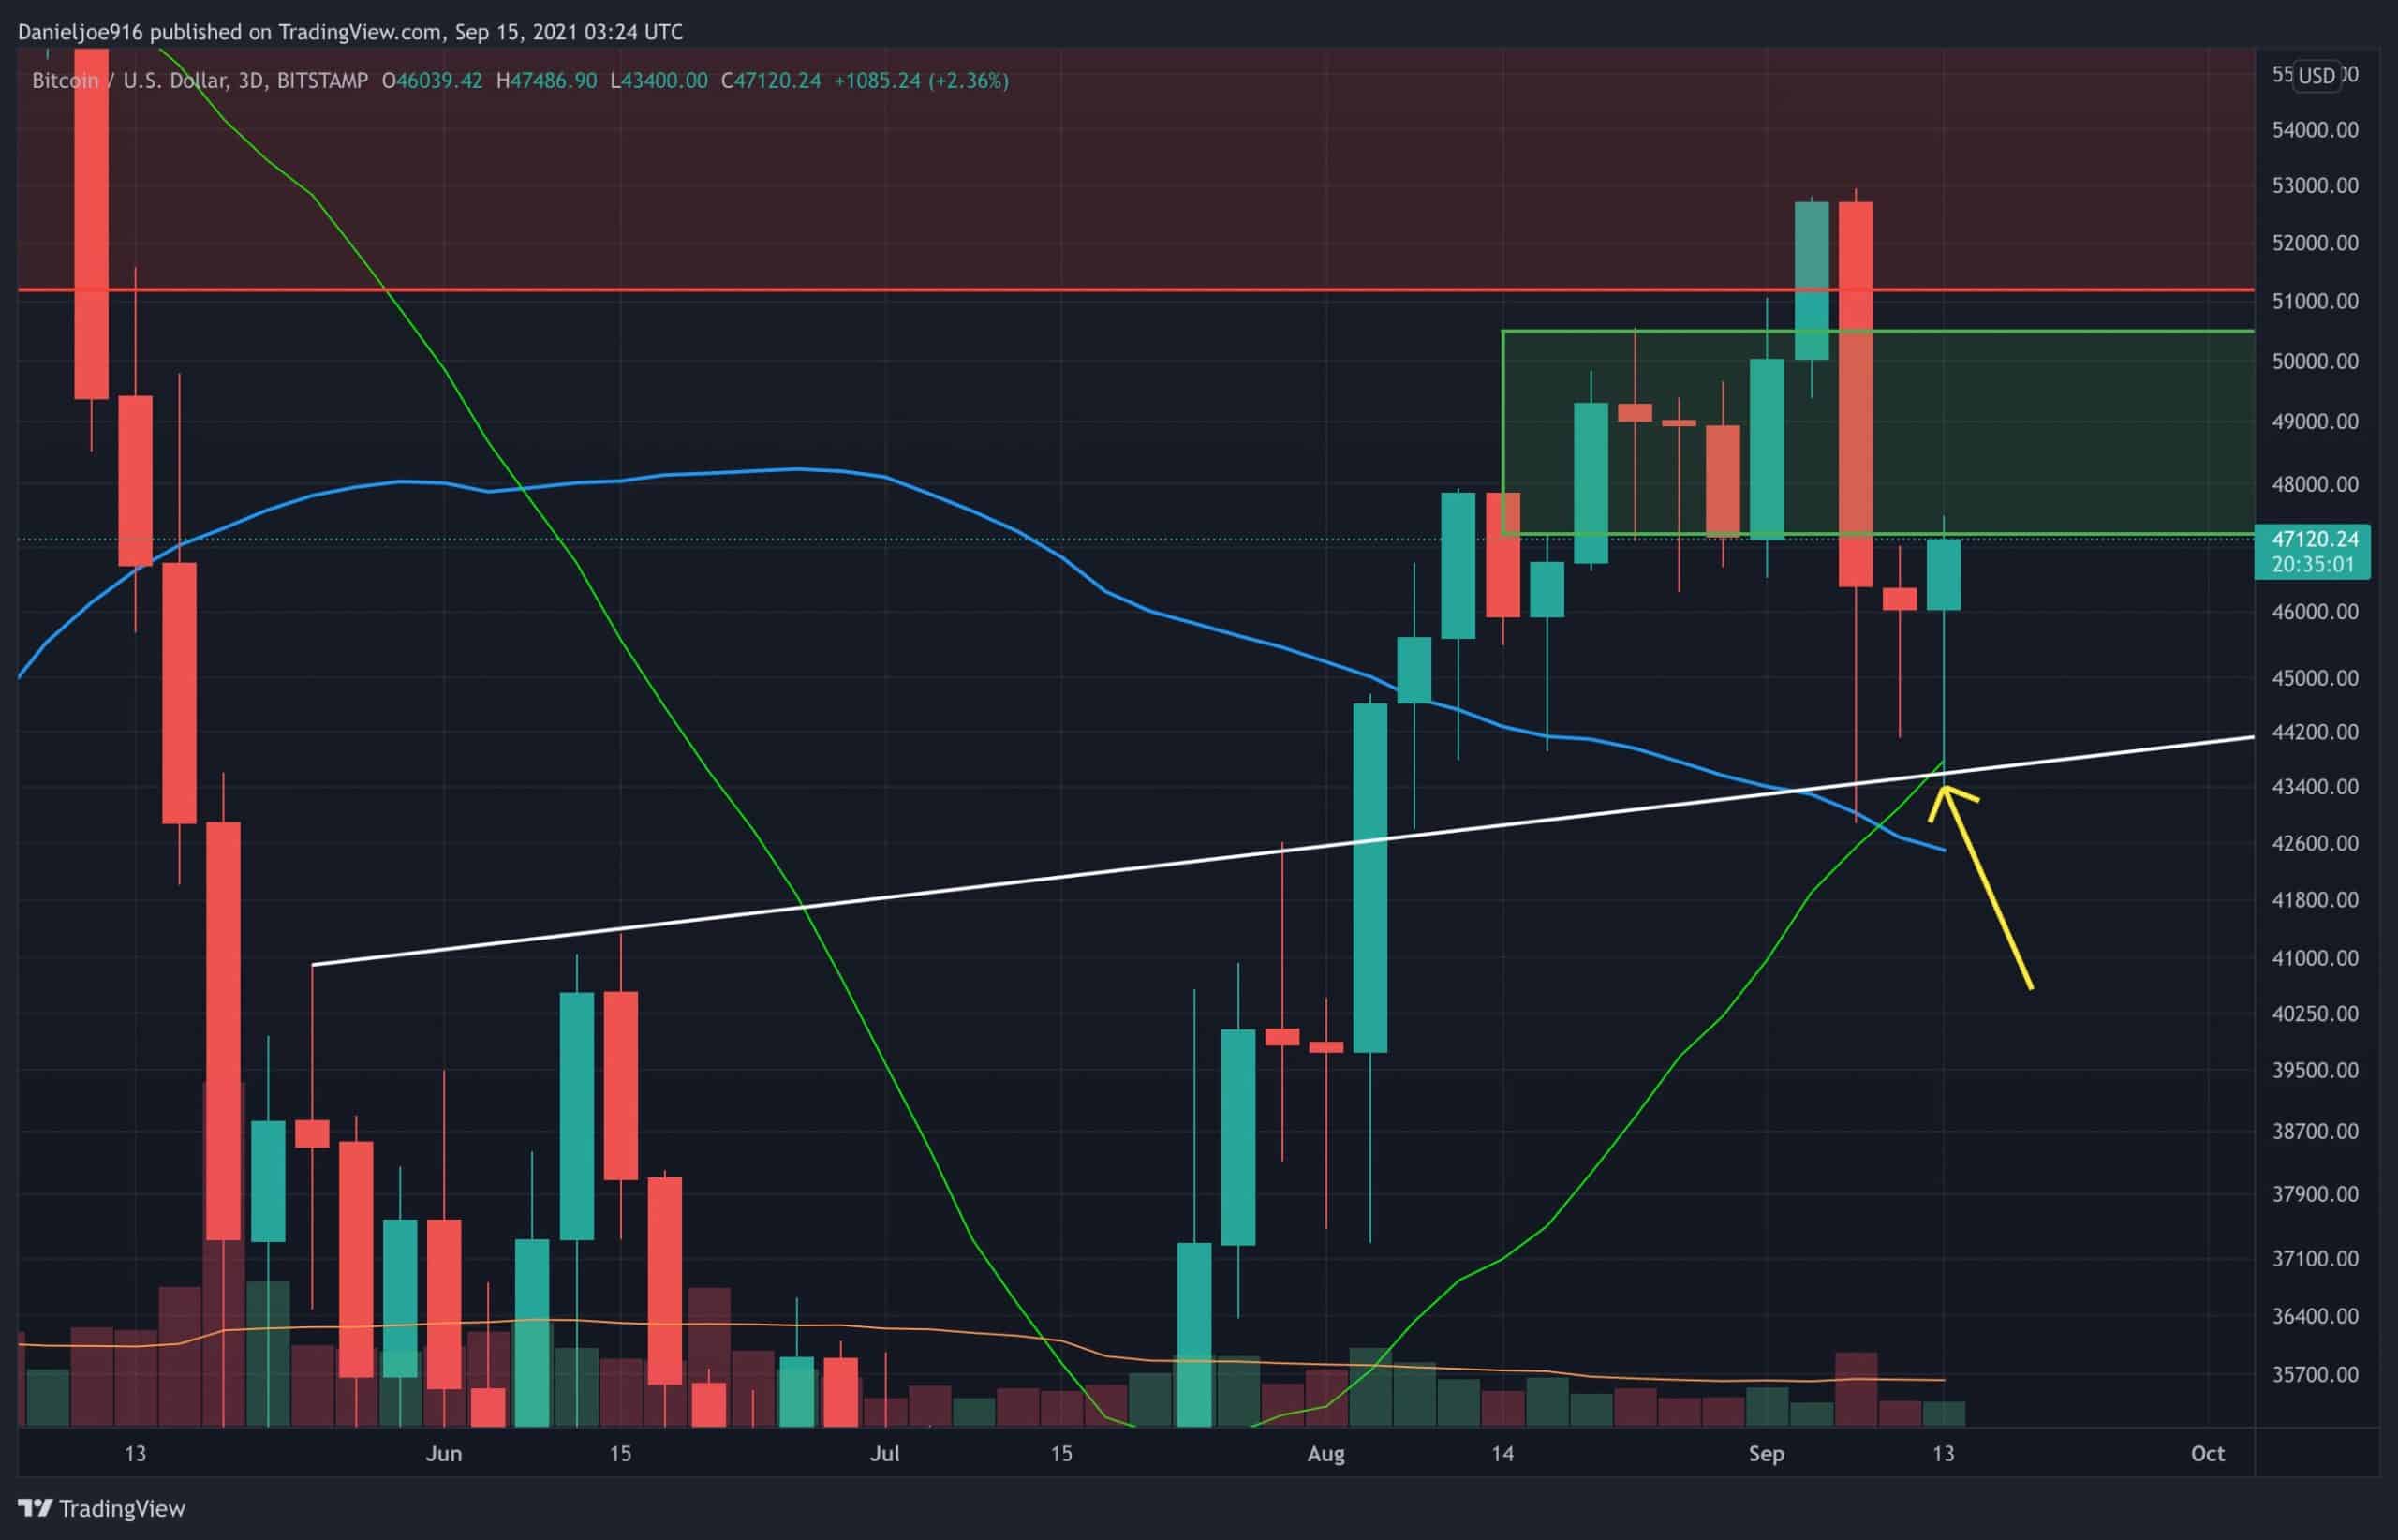
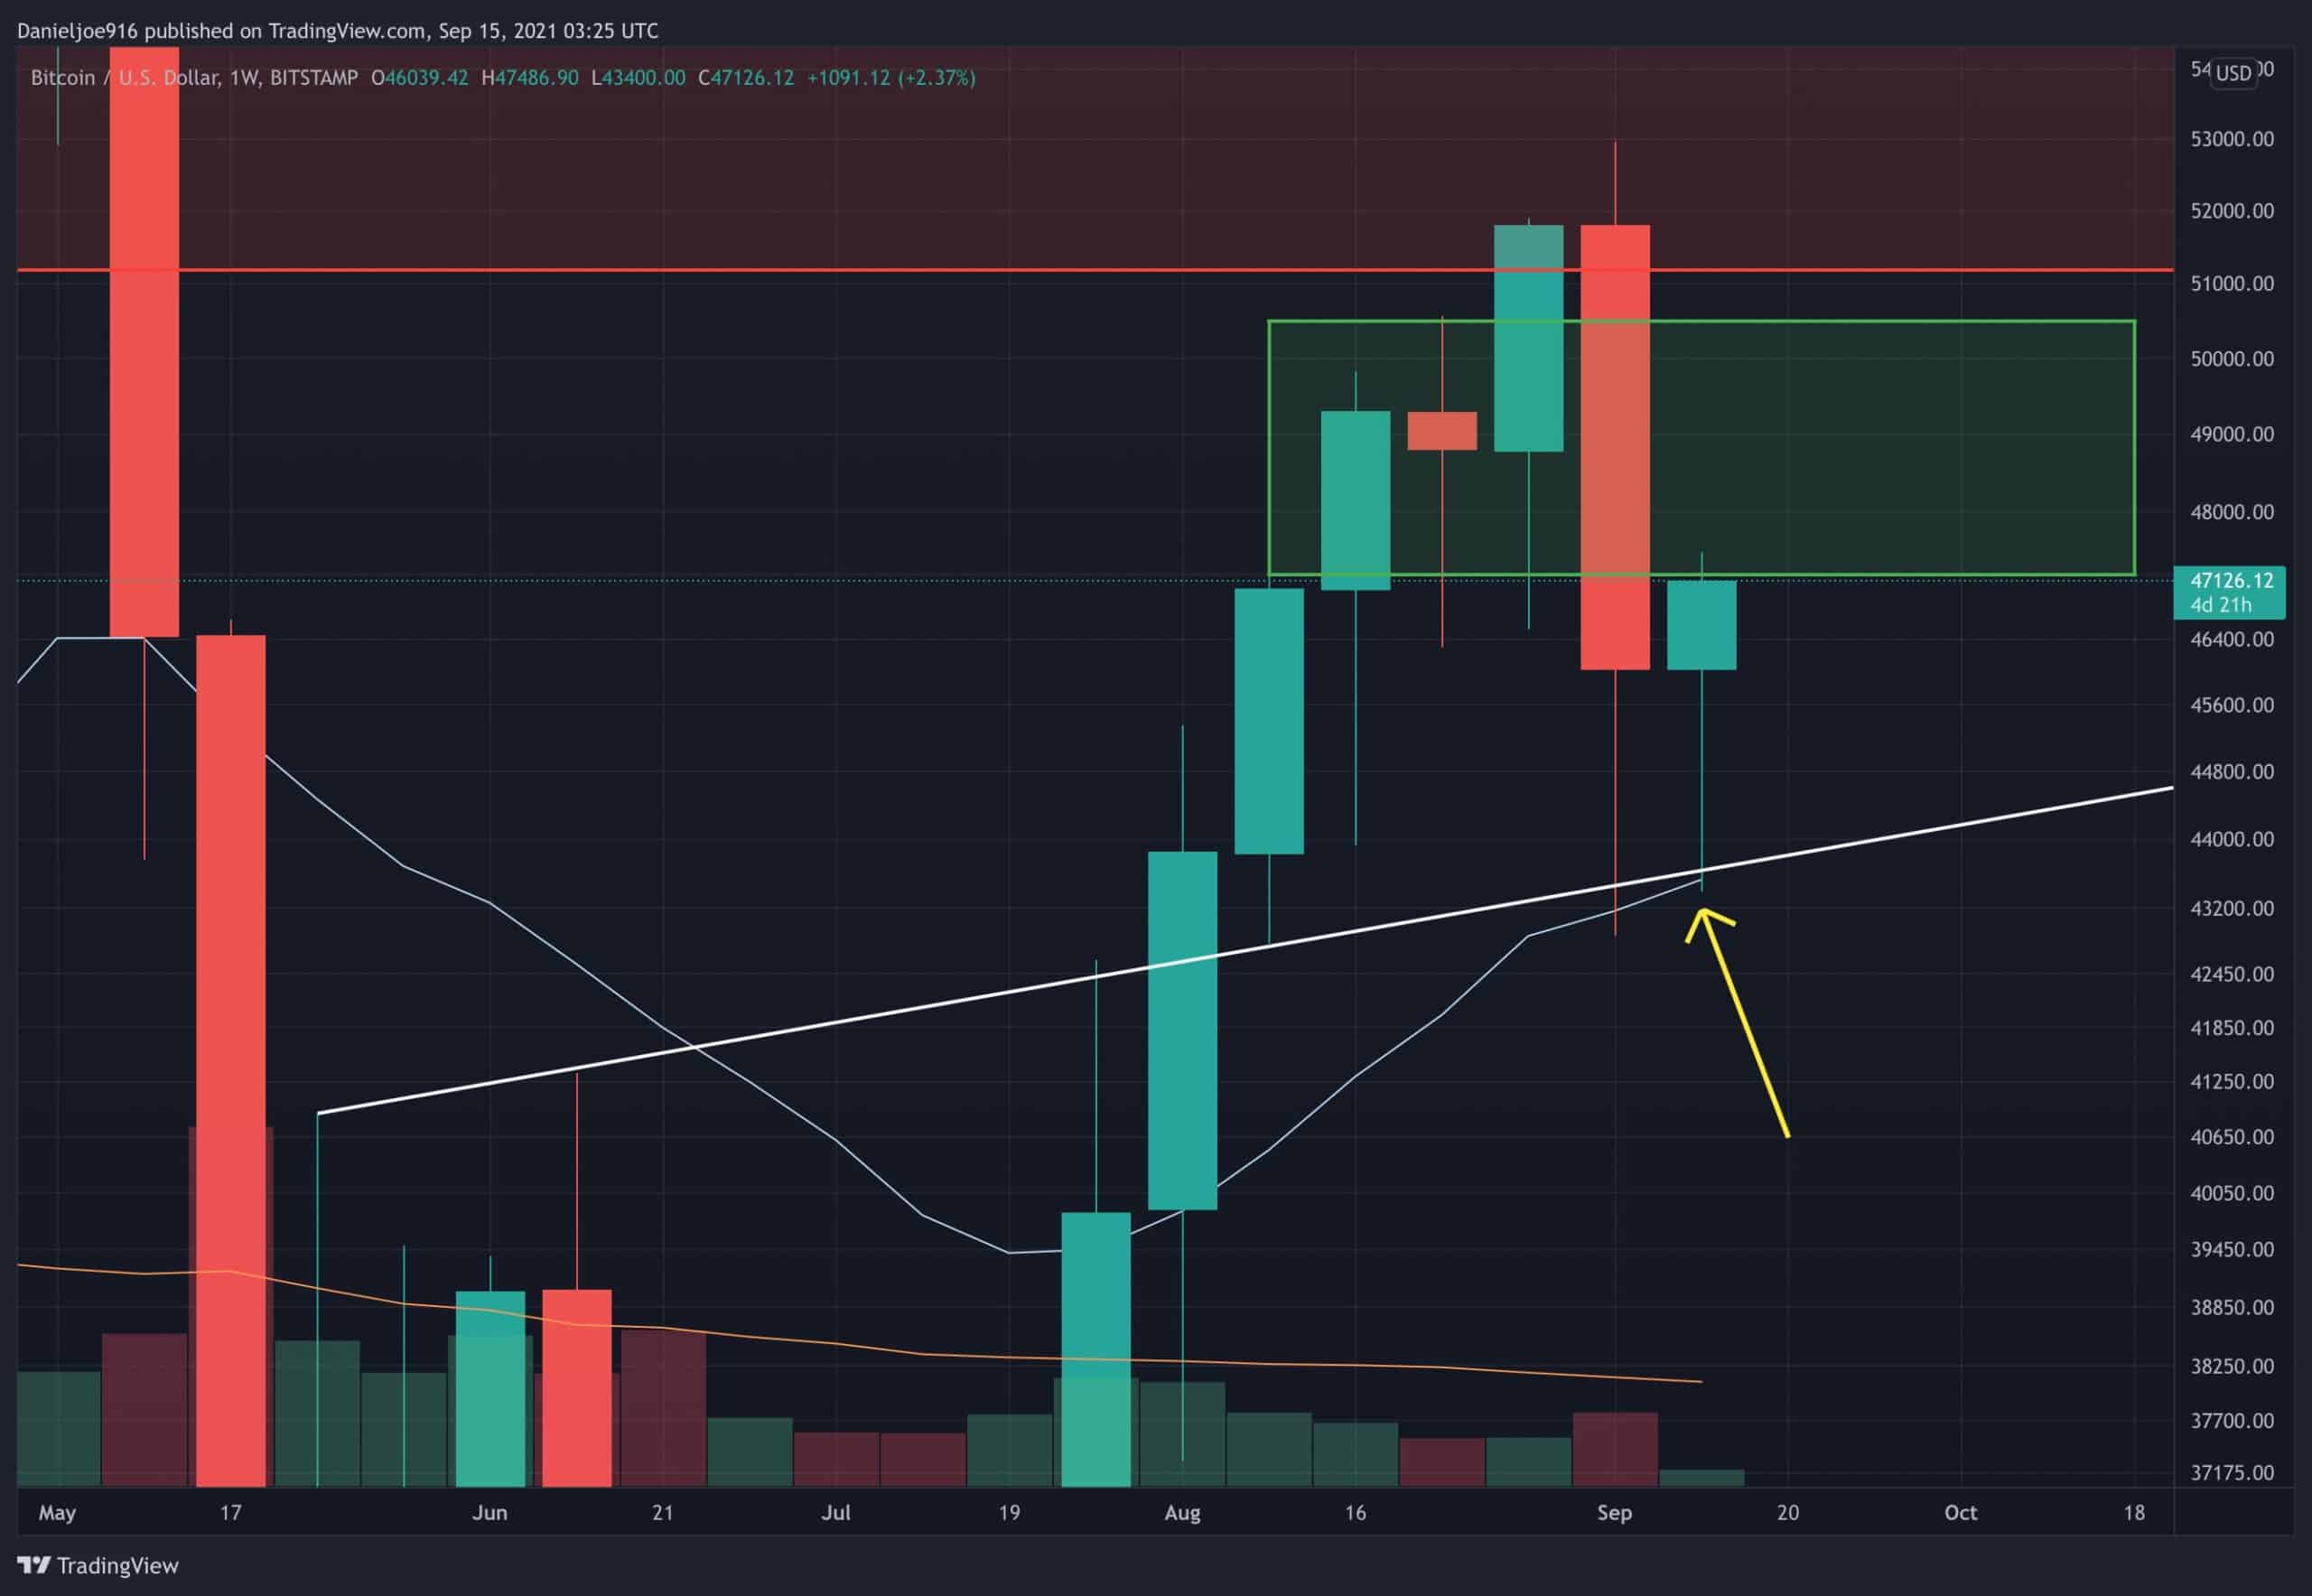
For the past week, BTC wicked to these levels twice and held support on a closing basis.
On-chain Remains Bullish
The near-term pullback continued to strengthen the overall trend in on-chain metrics. Spot exchange reserves continued to make multi-year lows as investors continued to withdraw BTC from exchanges. Once again, 3 to 6-month-old coins accumulated mostly between $50k to $64.8k were sold at a loss and scooped up by strong hands. In aggregate, Bitcoin miners keep accumulating with reserves increasing despite the nearly 19% correction from $52.9k.
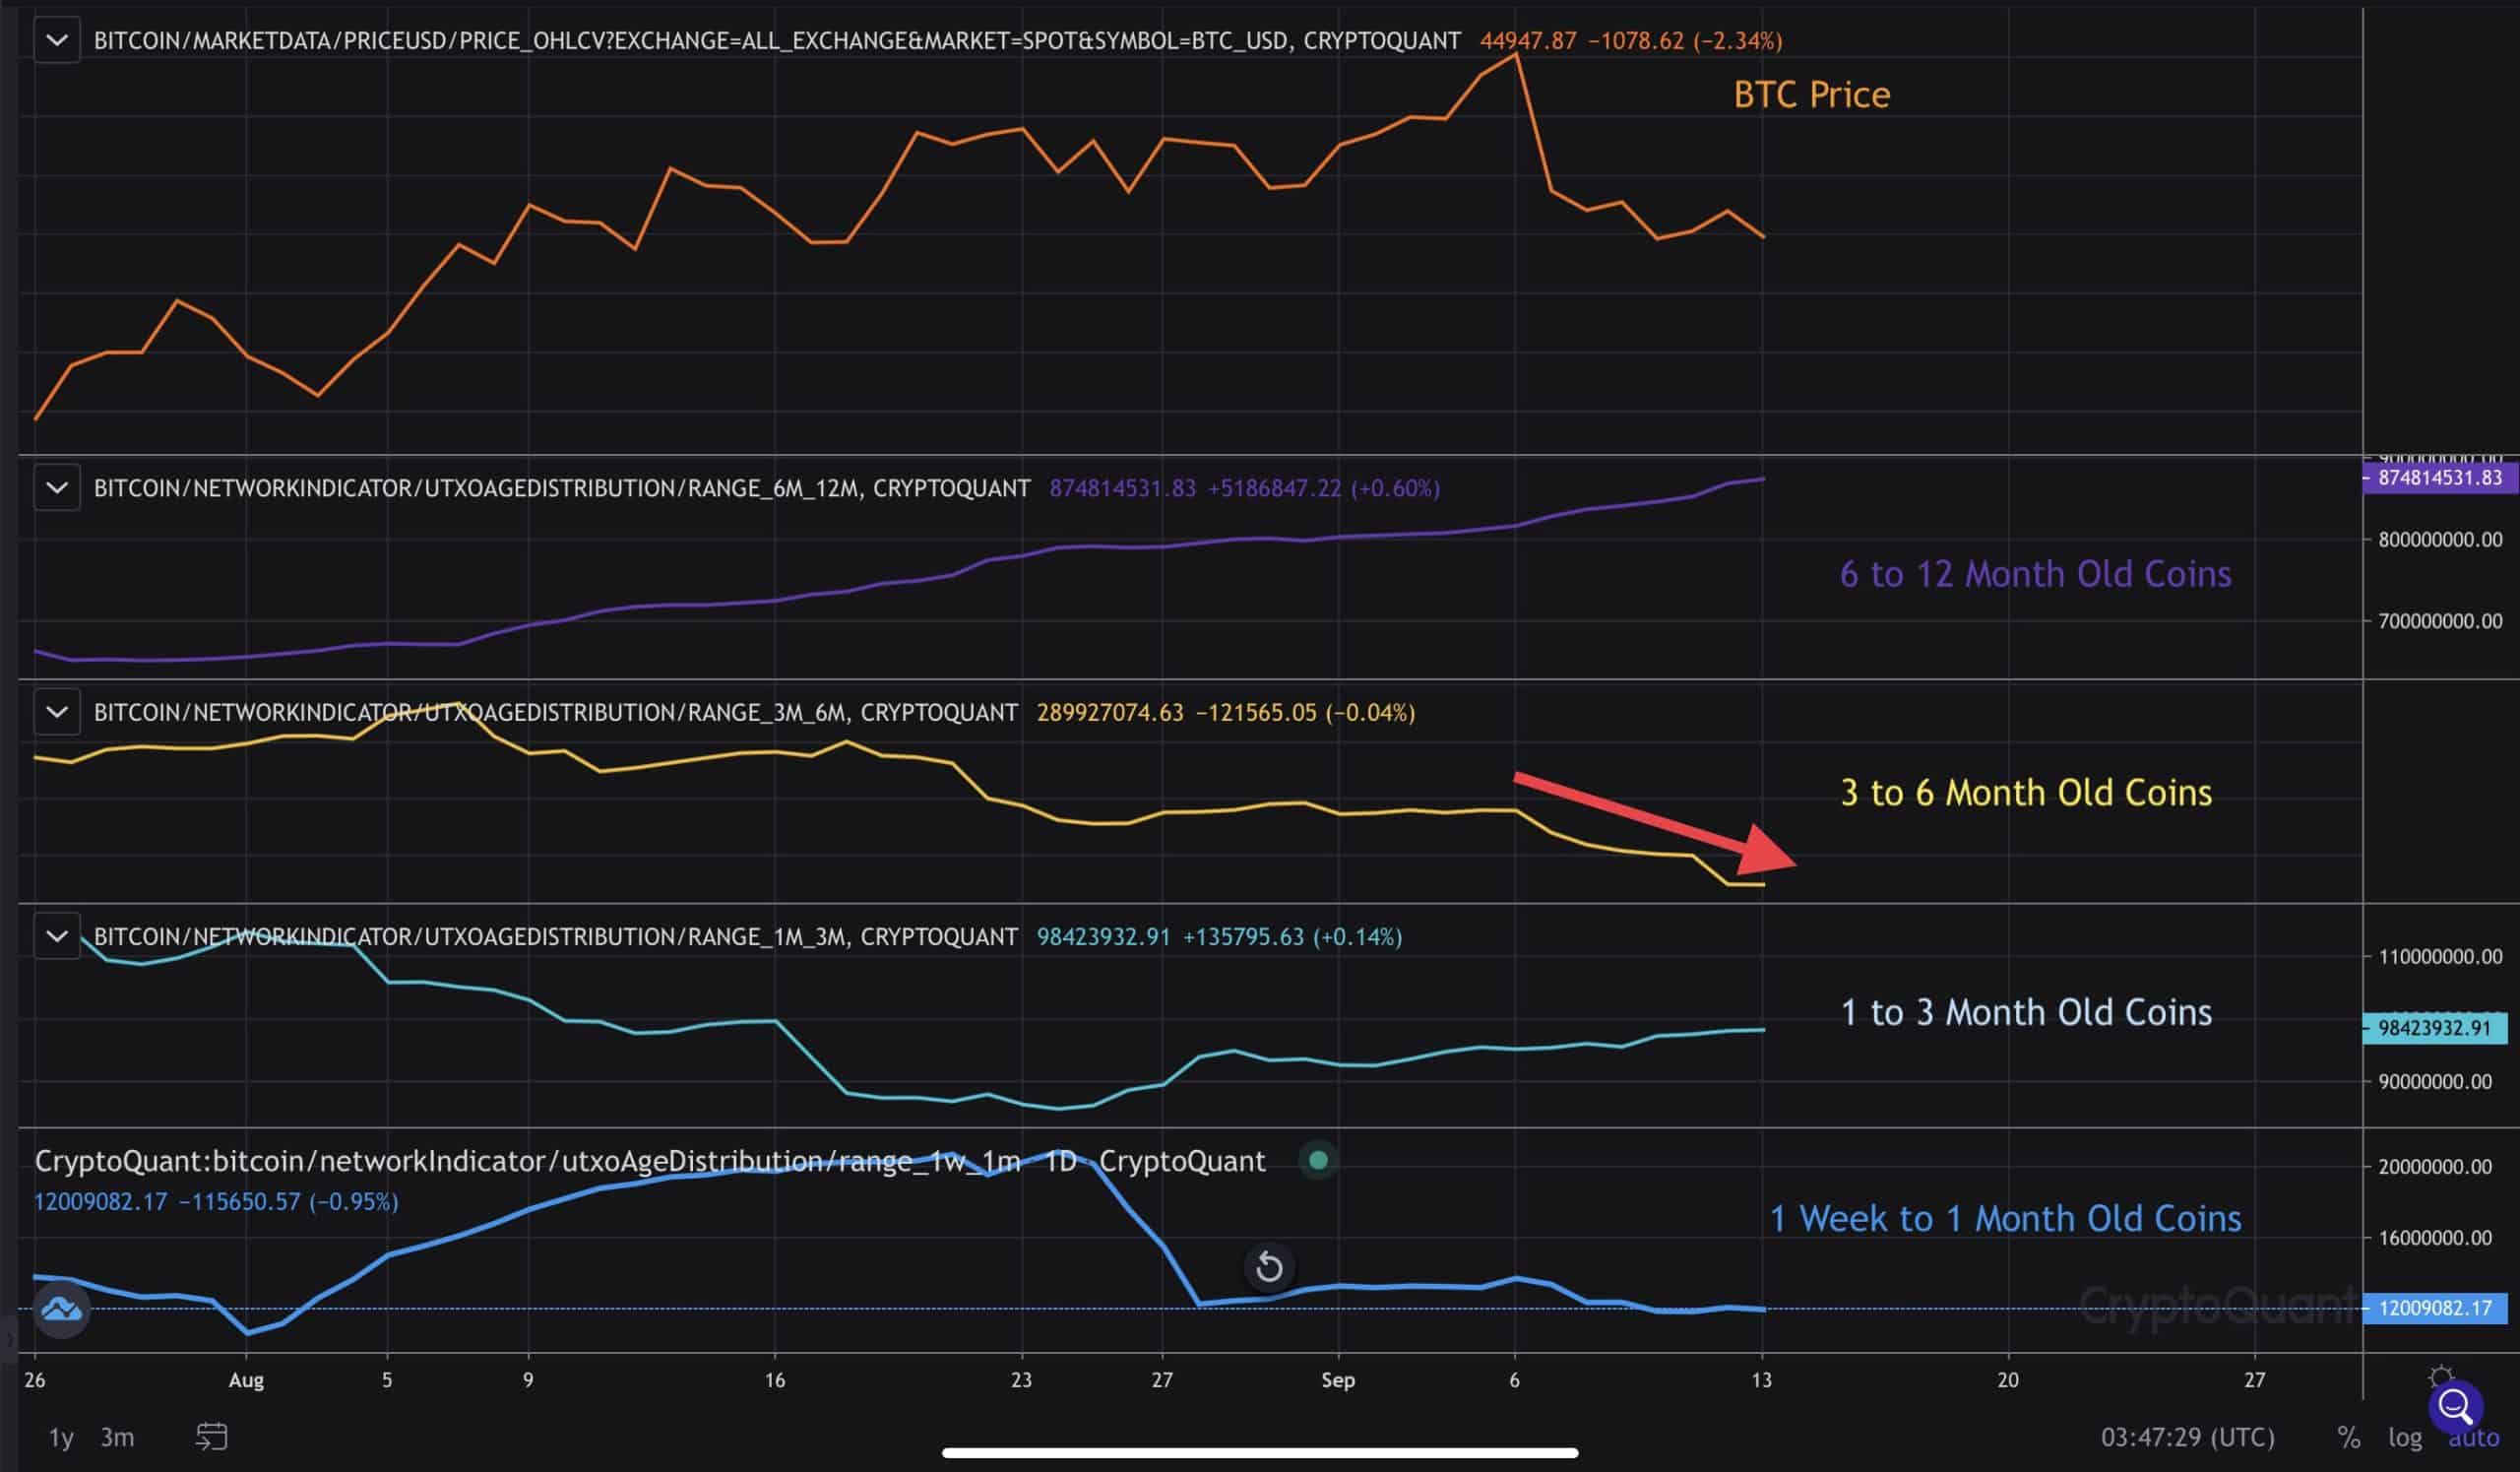
Chart by CryptoQuant
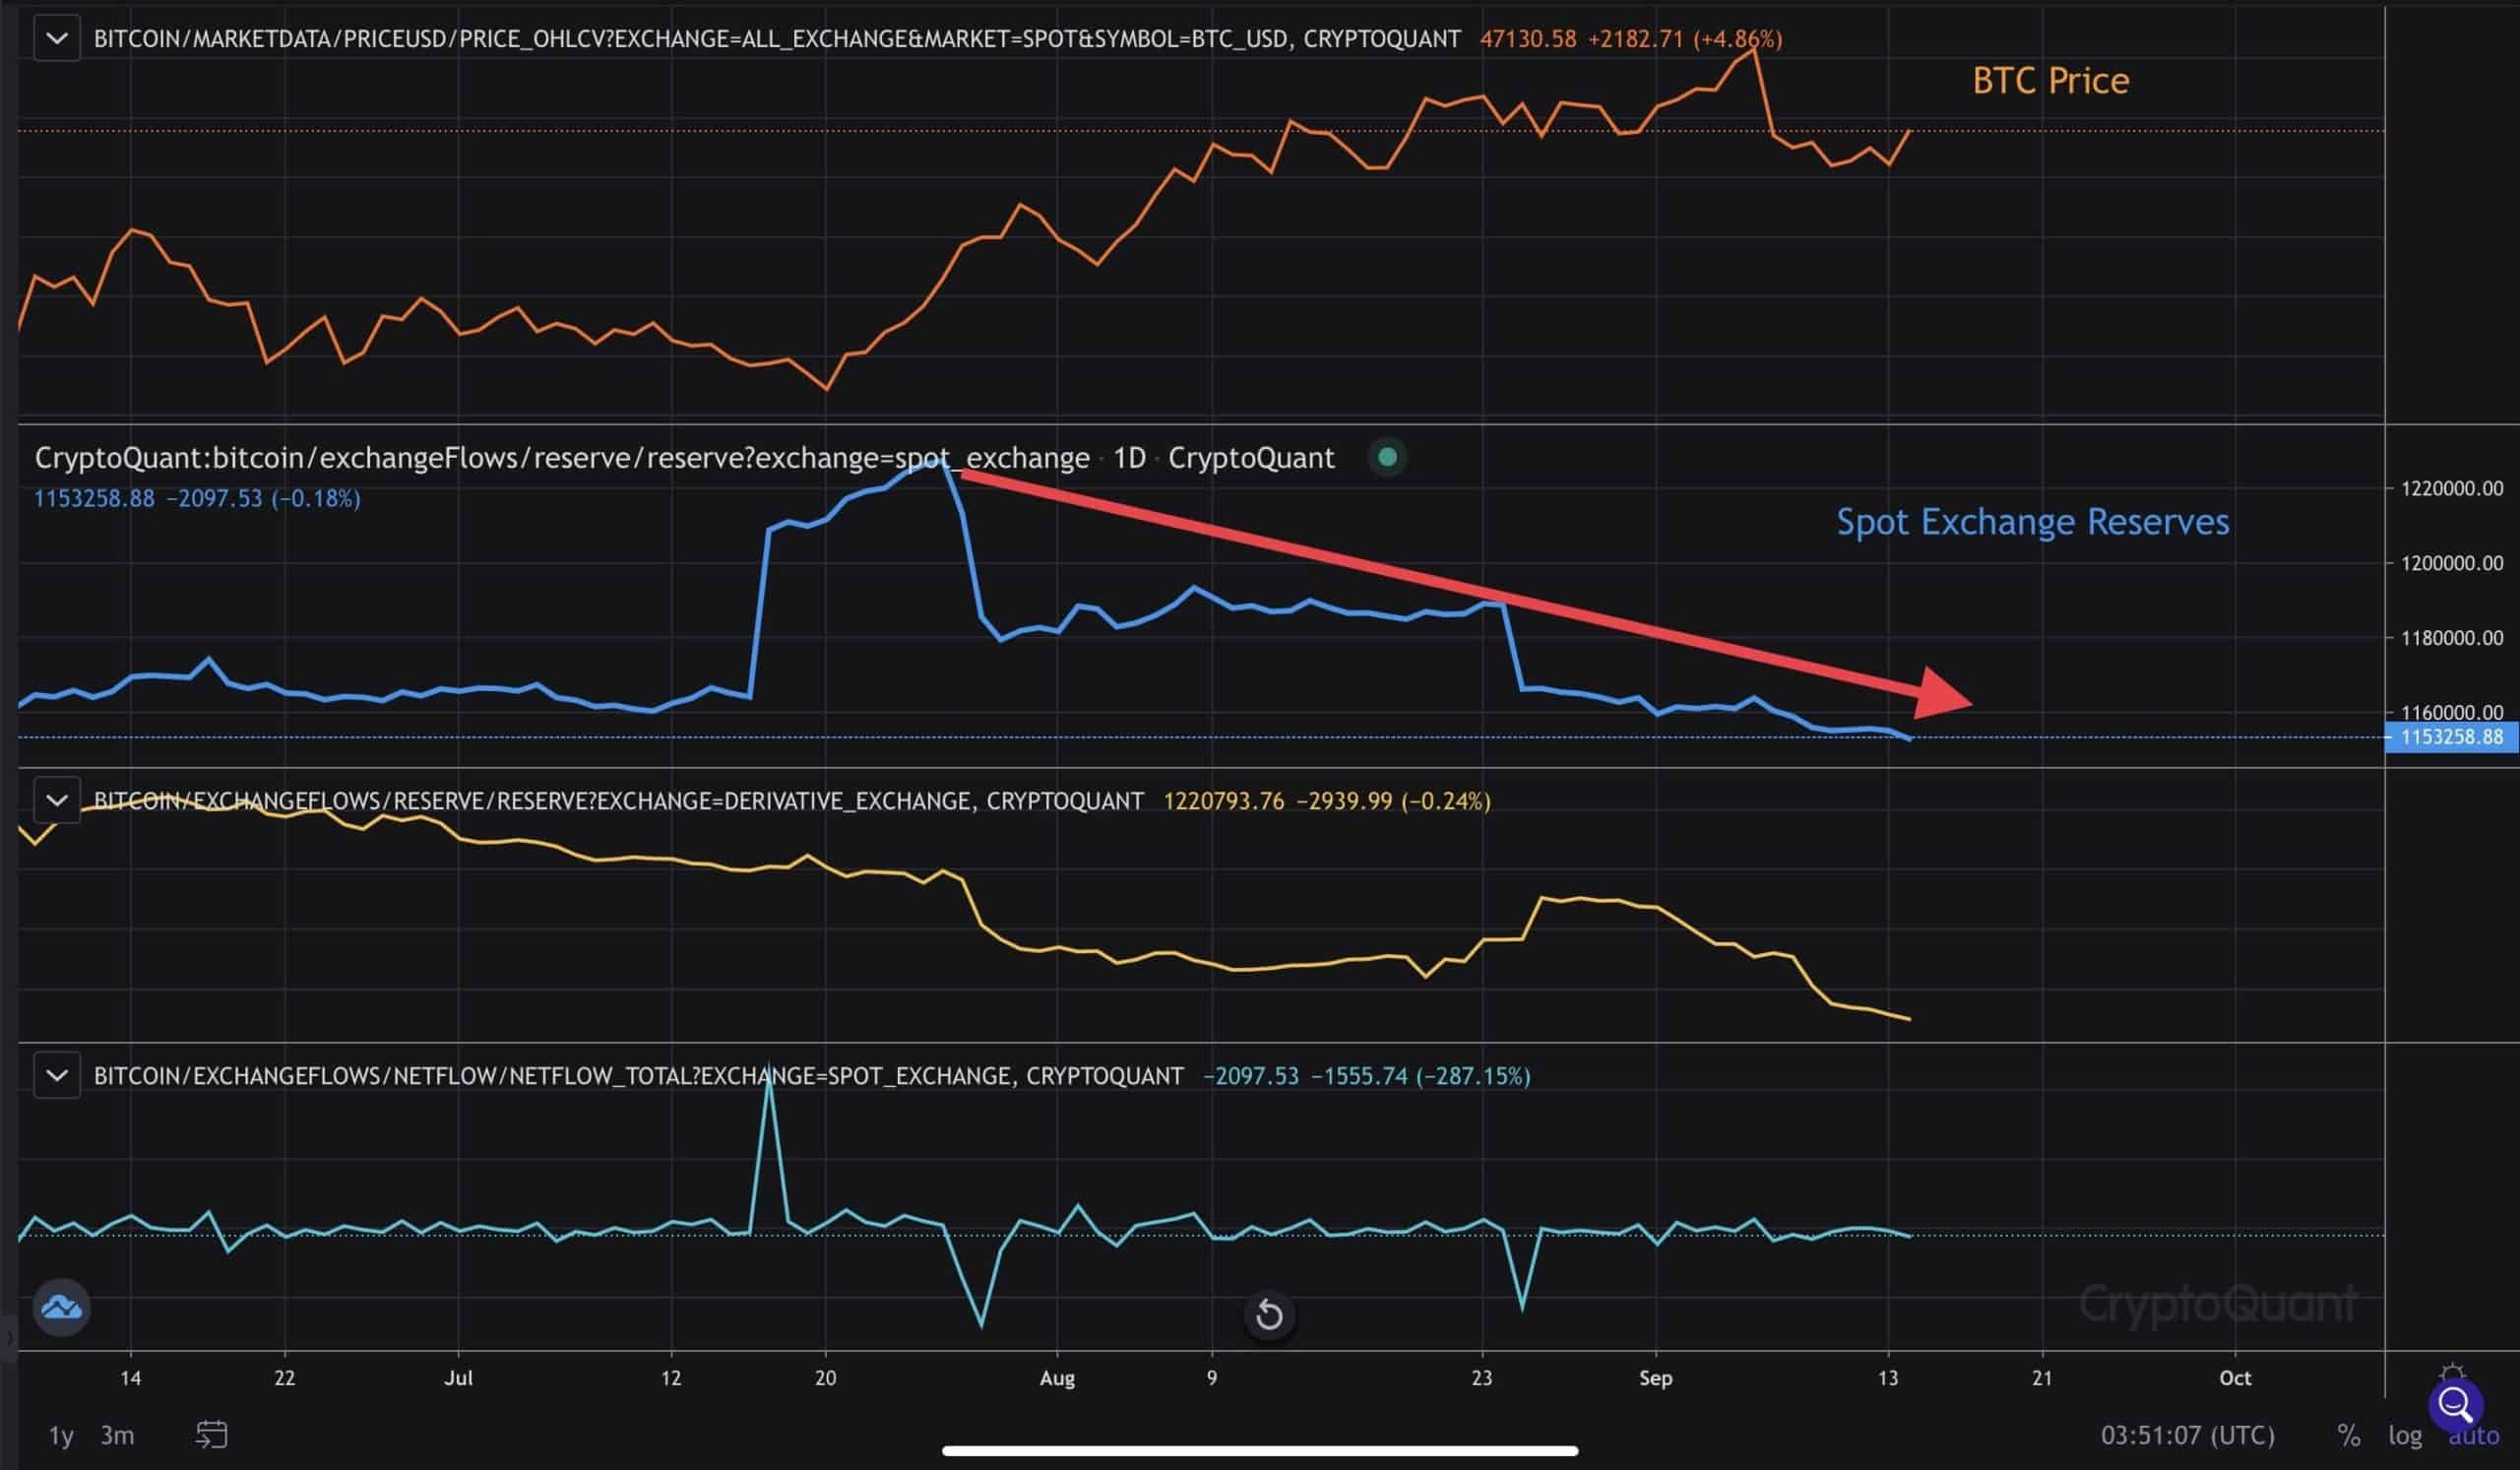
There are no major warning signals of whale exit liquidity, which occurs during bear markets where large long-term holders of BTC sell aggressively during rallies. As of now, the data strongly suggests that BTC is in a bull market continuation, and a significant rally to new highs is likely if the bullish on-chain trend continues.
BTC Outperforming Stocks
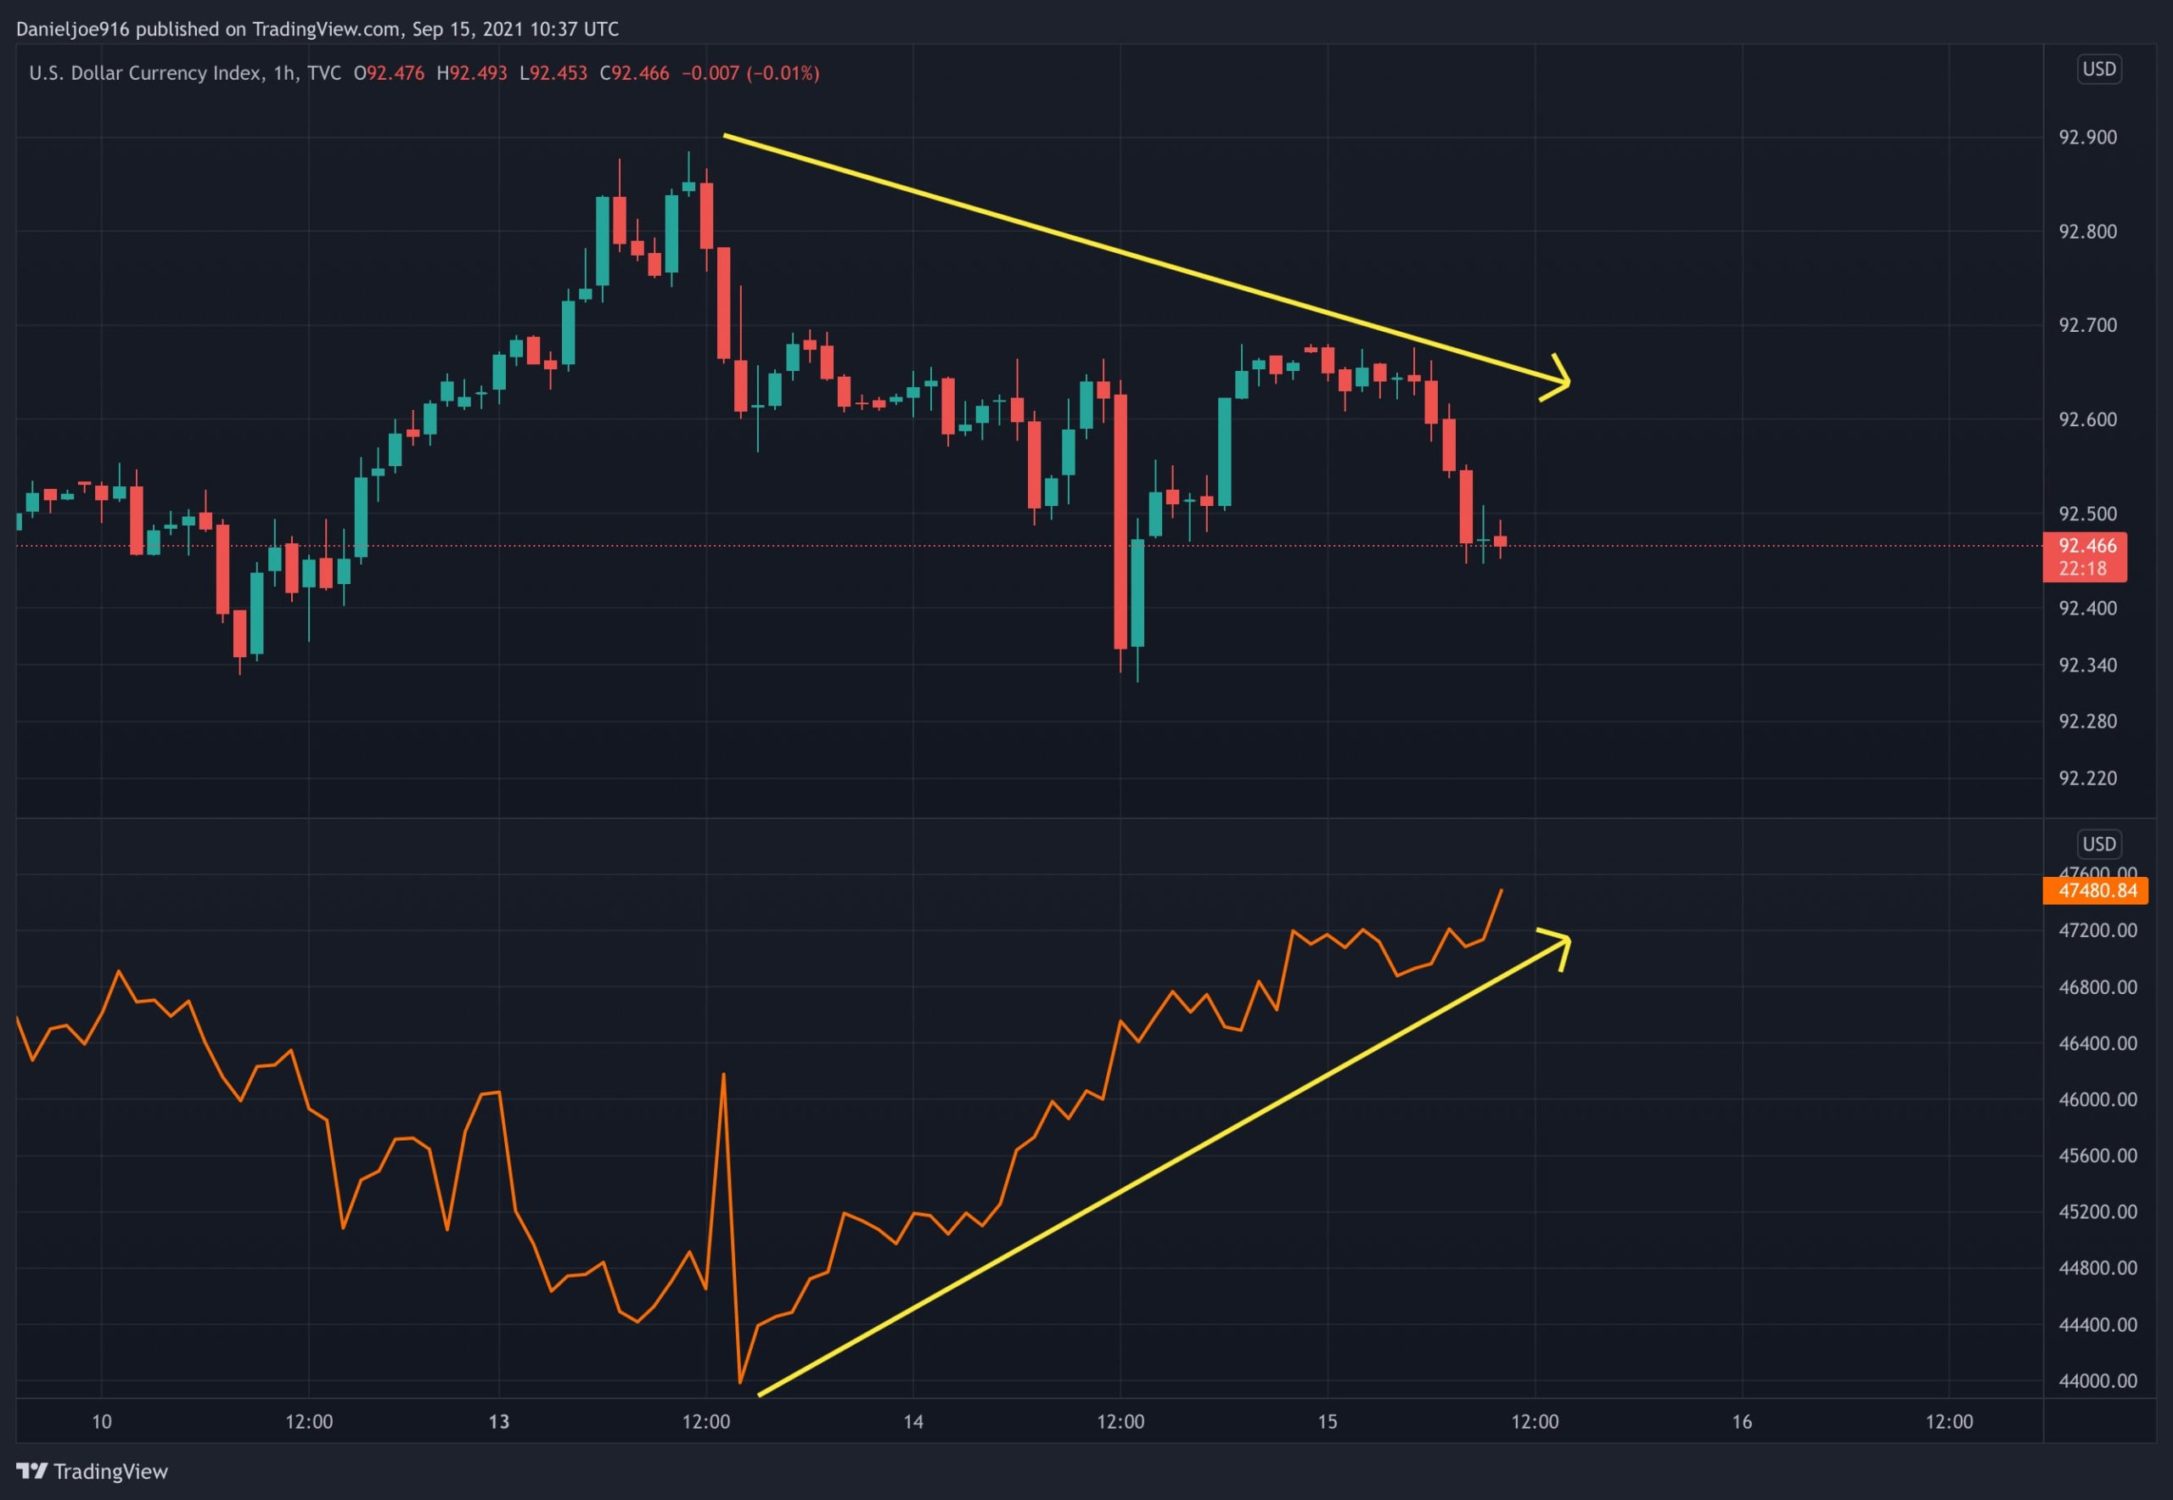
Notably, BTC has started to outperform stocks, managing to close higher by 4.7% while the SPX closed lower by .57%. The dollar has been trending lower even with risk-off in stocks.
Normally, when there is fear in the market, investors sell stocks and go into the dollar, causing it to rise. In addition to bullish on-chain data, BTC’s near-term recovery could also be fueled by investors rotating out of the dollar into BTC. Keep in mind, a falling dollar is very bullish for Bitcoin.
Historically, major risk-off events in stocks have also caused BTC to correct. Near term, it is good to see Bitcoin diverging from the risk-off environment. The bulls need to see the technical momentum continue higher and to also validate the widely discussed golden cross.
With the overall trend in fundamentals, technicals, and on-chain metrics stronger than ever, it’s looking more likely for BTC to start reclaiming $47.2k to $50k in the coming week. The best-case scenario for the bulls would be reaching $55k to $58k by the end of the month, which has a major technical and on-chain zone of resistance. If BTC can successfully close and stay above the $55k to $58k zone, the path to new all-time highs looks highly likely to be achieved in October 2021.