Bitcoin’s recent decline has transitioned into a consolidation phase, with the price oscillating between two well-defined ranges. The broader structure suggests that the market is cooling after the sharp post-rally correction, while the recent pullback to the 100-day moving average has provided short-term concerns.
BTC Price Technical Analysis
By Shayan
The Daily Chart
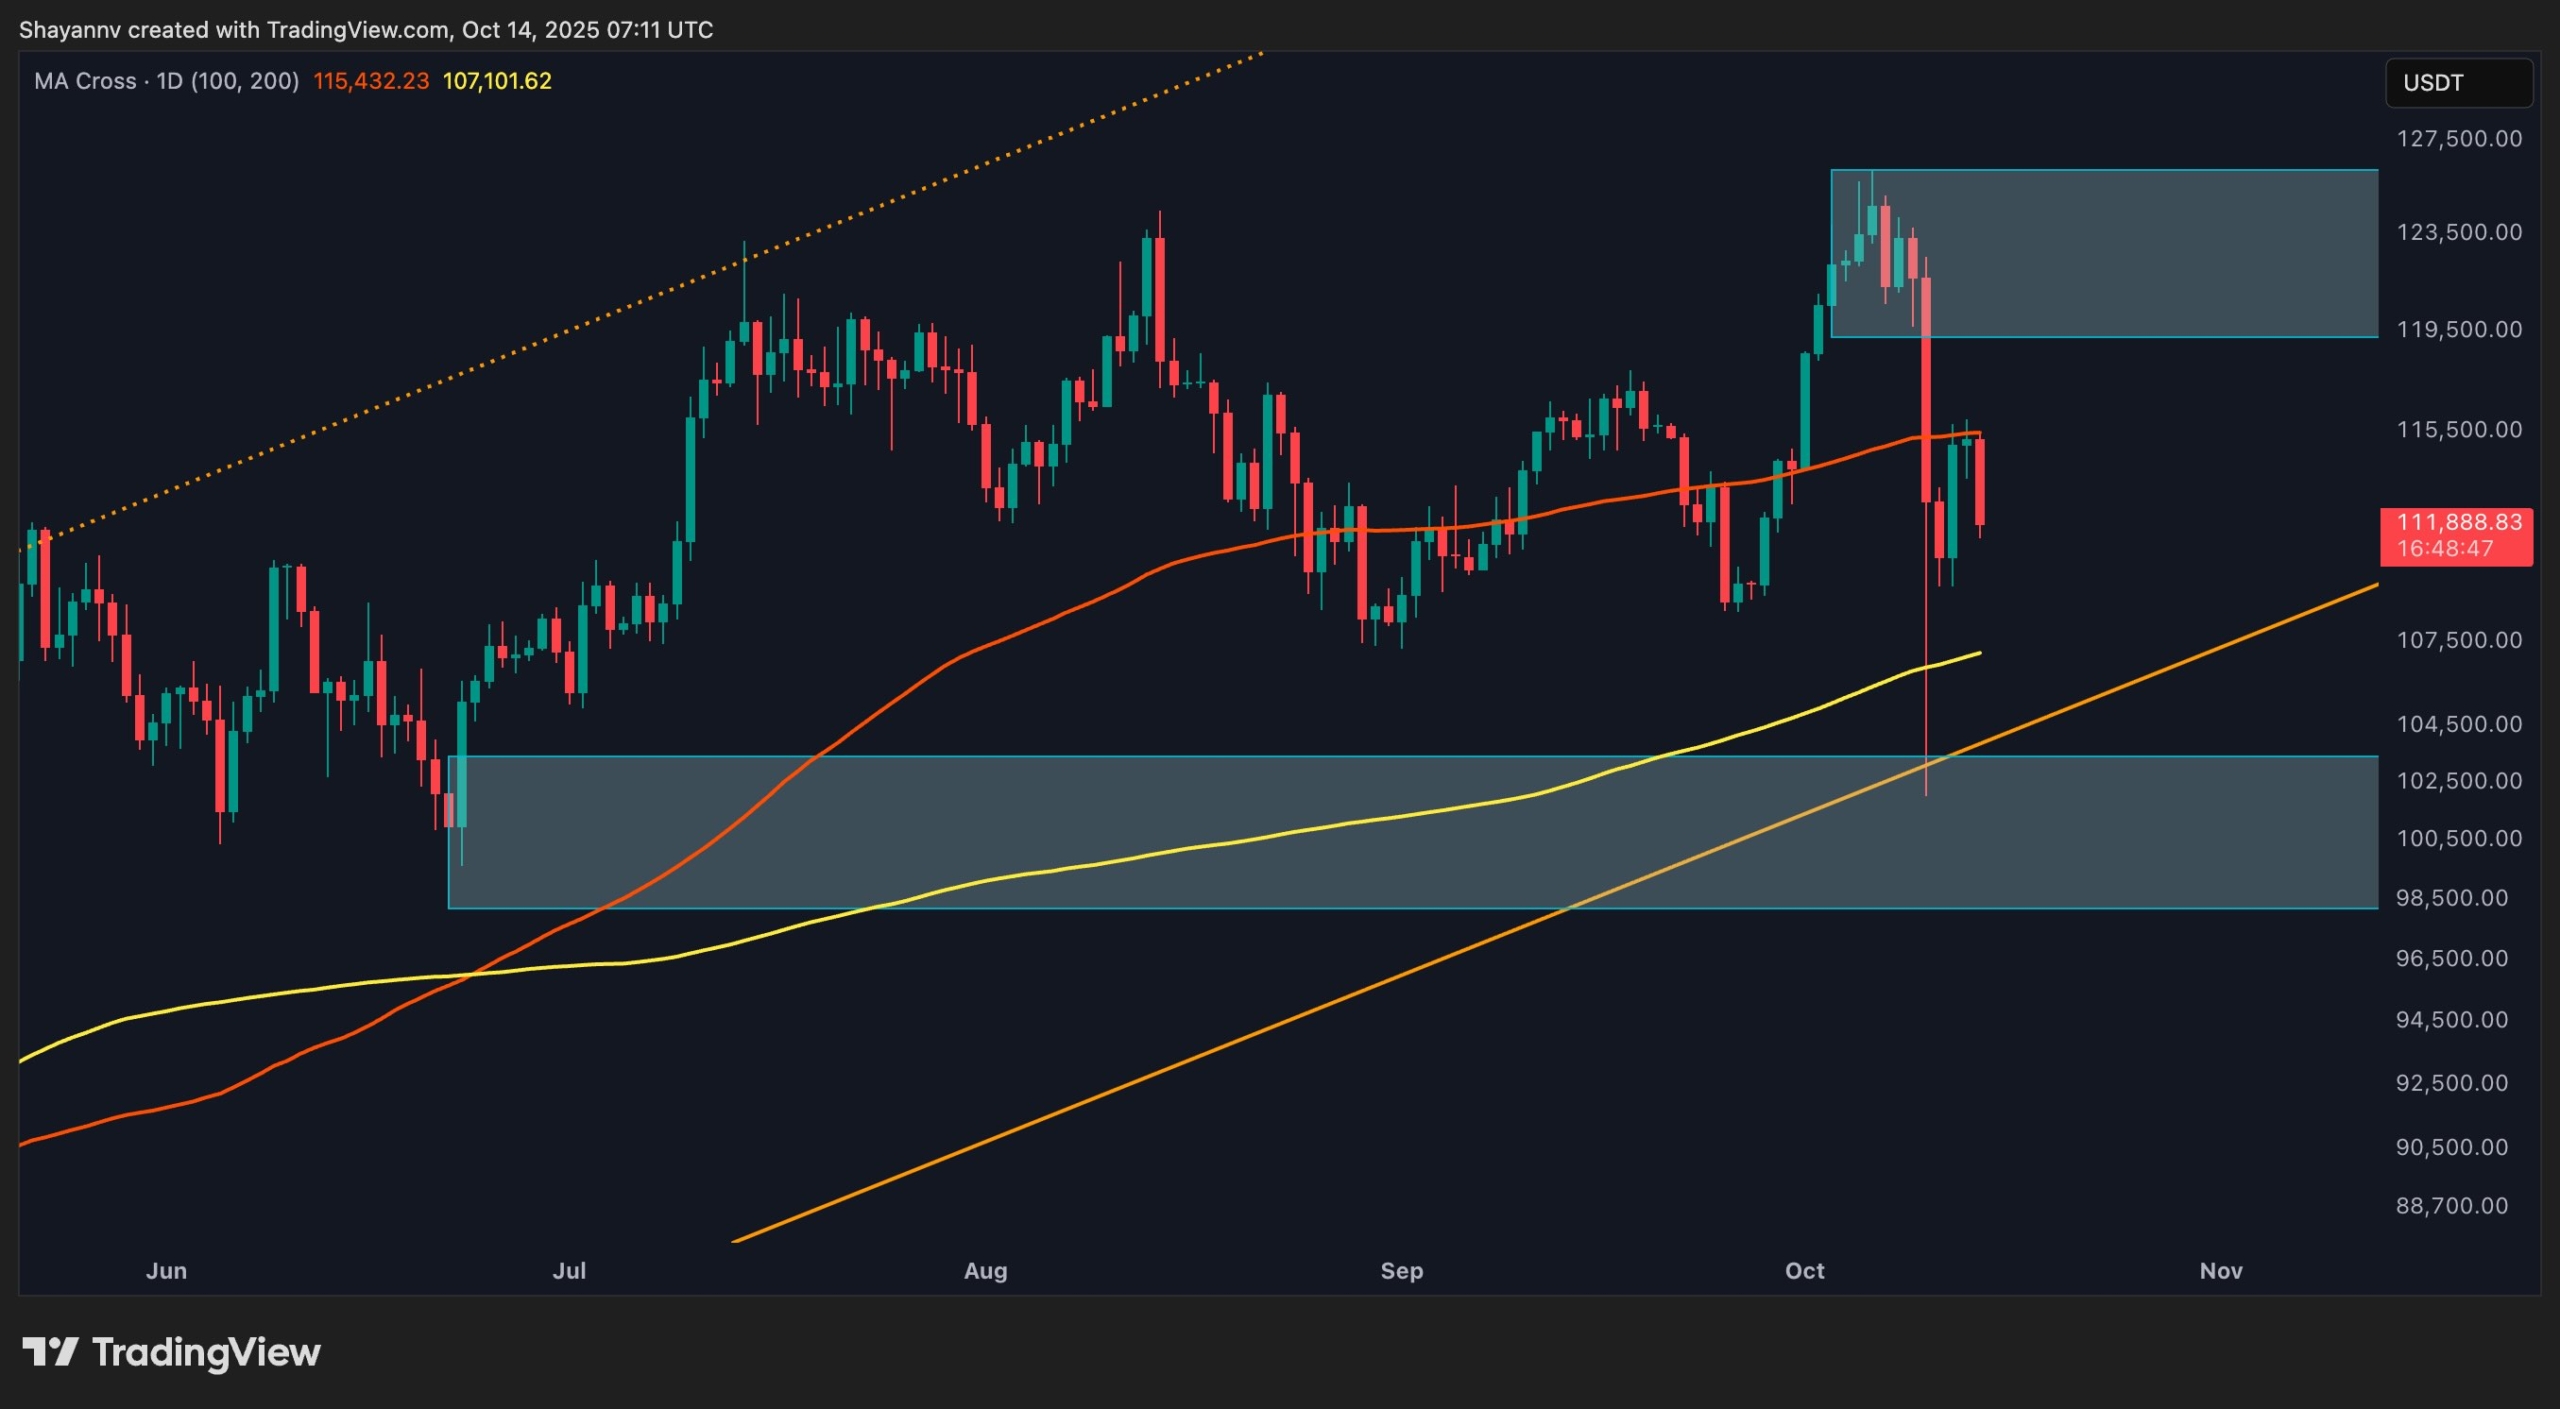
On the daily timeframe, BTC has pulled back to retest the 100-day moving average, coinciding with the $116K zone, where the price has temporarily stabilized after last week’s breakdown. This area aligns with the midpoint of the local structure and sits above the $107K–$109K demand zone, which remains a crucial defensive region.
The rejection from the $124K–$125K supply area led to a clean liquidity sweep above the prior highs, followed by a sharp retracement. While the correction was steep, the structure has yet to fully break down, the $108K range continues to act as static support, while the 200-day MA around $107K provides additional confluence below.
For now, Bitcoin appears to be capped between two MAs, expected to consolidate. Sustained acceptance above the 100-day MA could signal stabilization and set the stage for a gradual recovery, but losing this level could open the door for deeper tests toward the $104K–$102K macro support.
The 4-Hour Chart
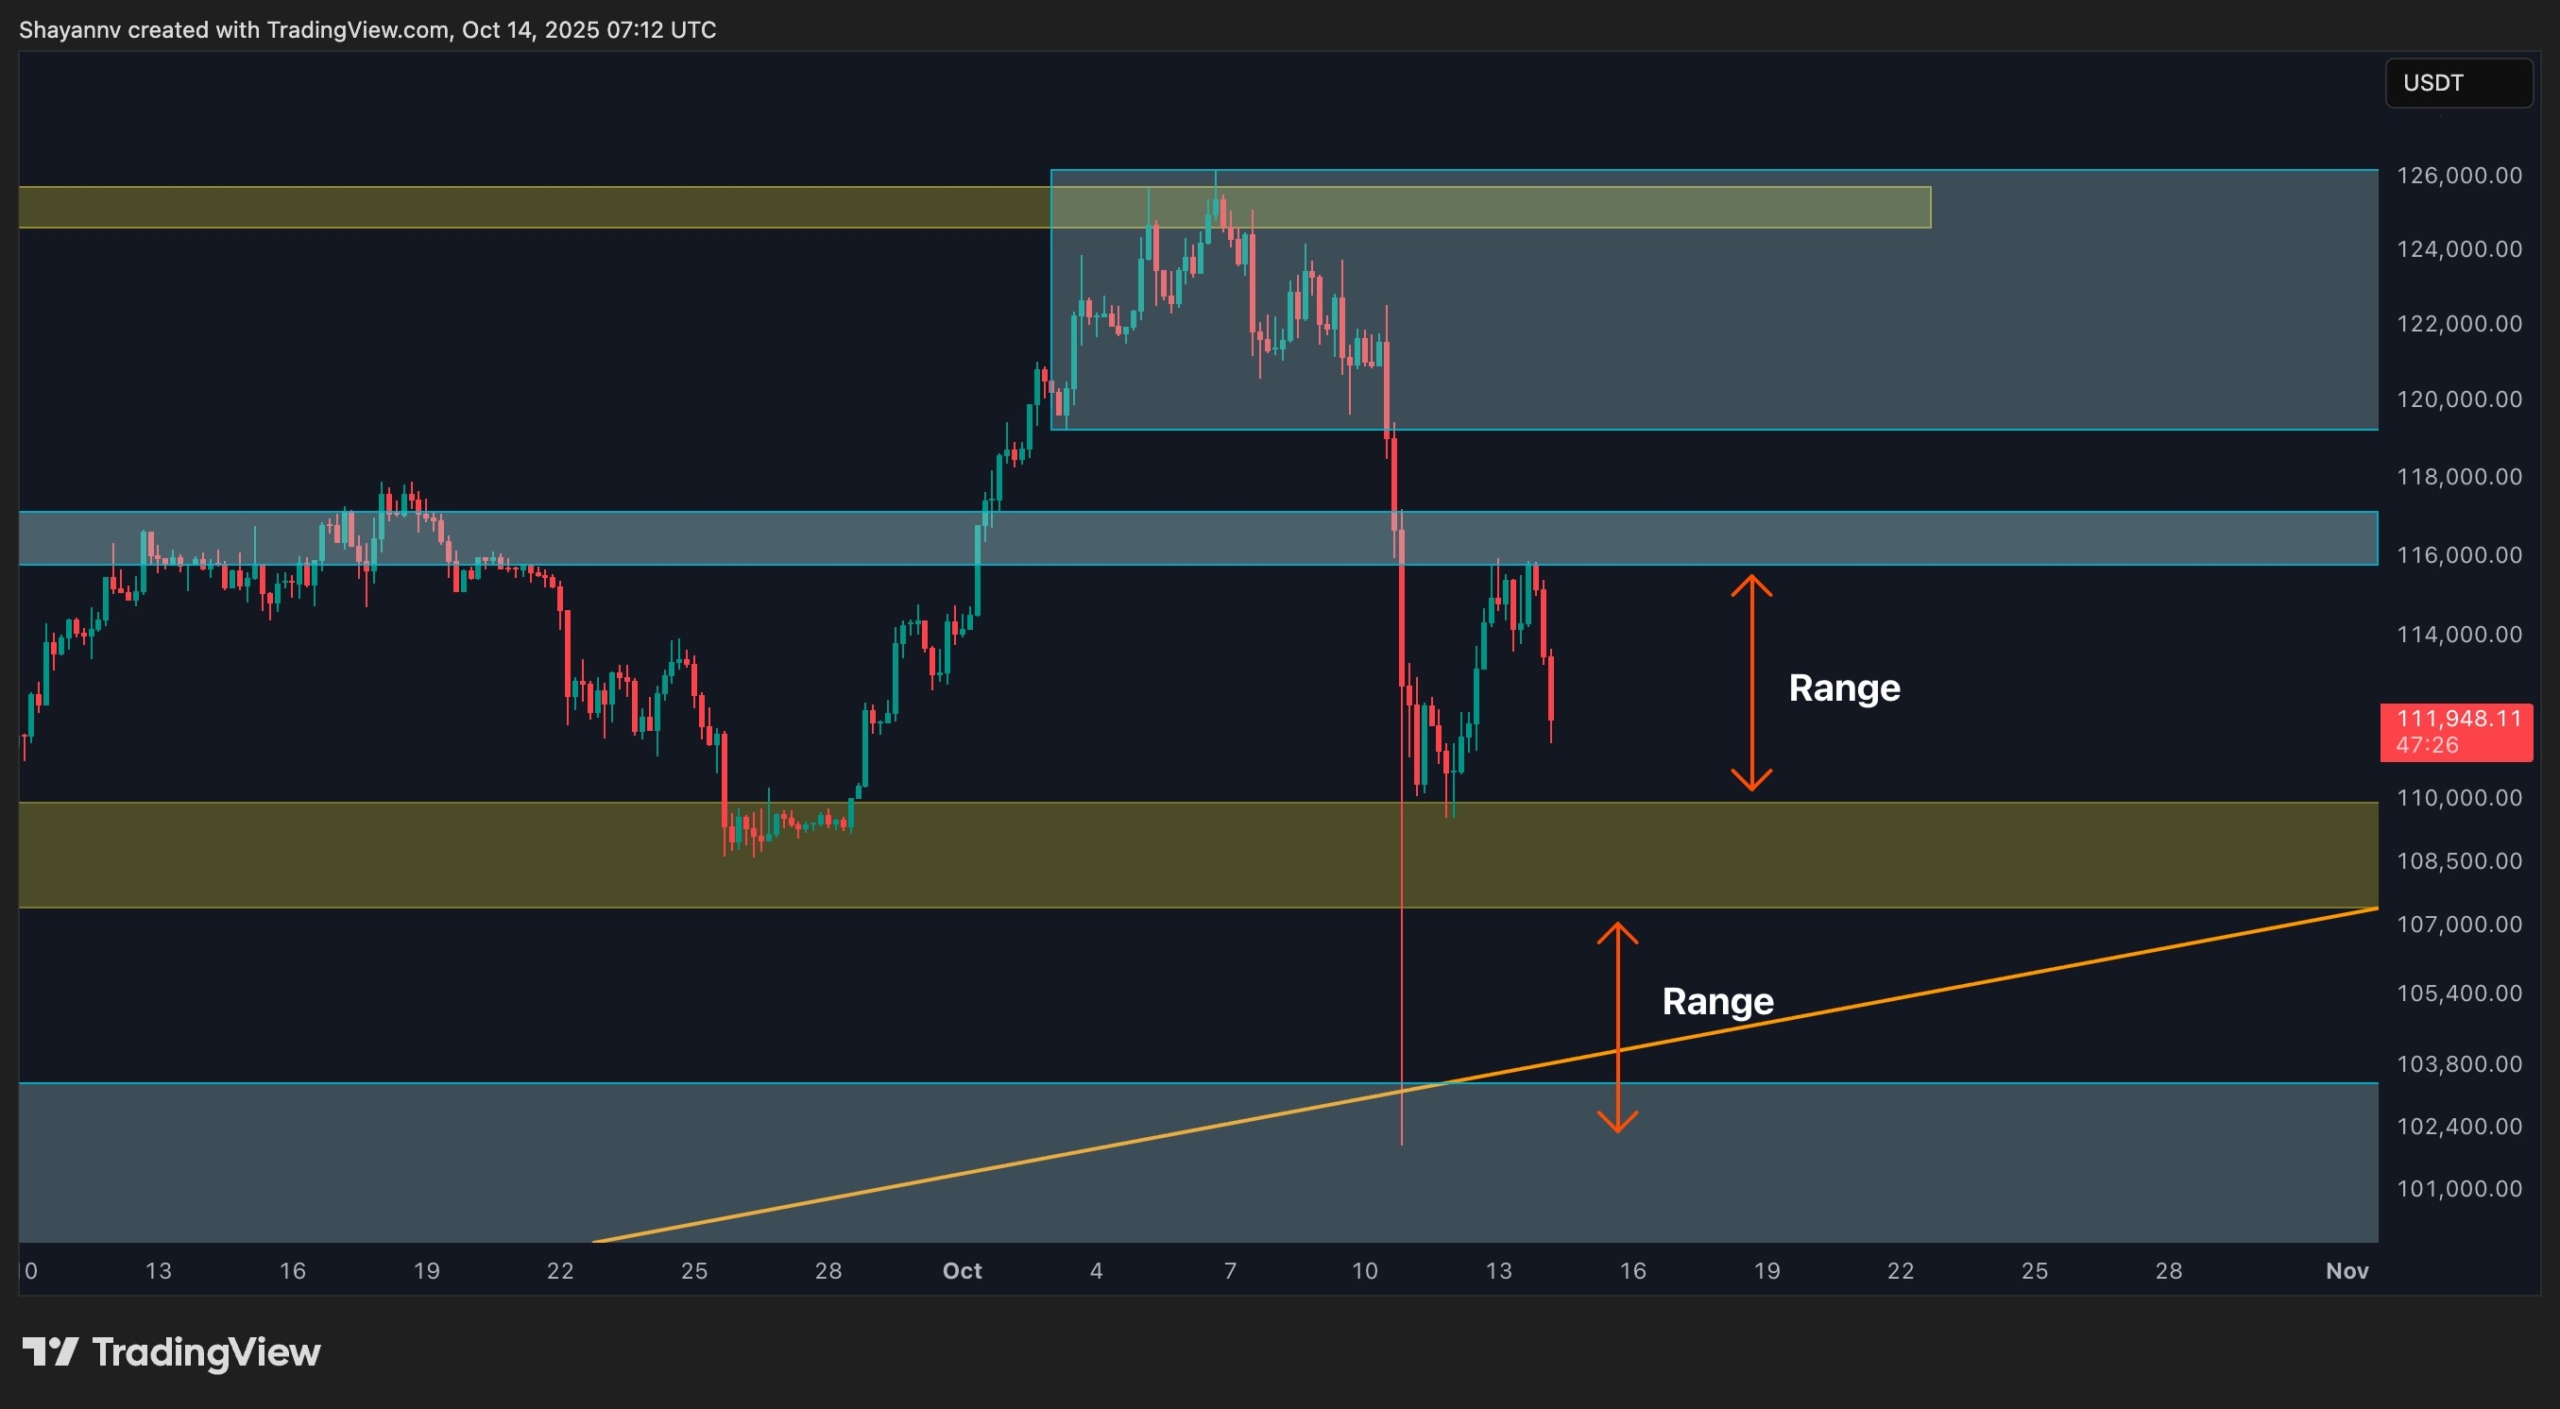
On the 4-hour chart, Bitcoin continues to move within a defined horizontal range, trapped between the mid-range resistance at $116K and the local demand zone at $109K. The recent rejection from $116K marks the upper boundary of this consolidation, while the lower range aligns with the same area that previously served as breakout support during the last upward impulse.
The repeated rebounds from the $109K–$110K zone suggest the presence of responsive buyers, though momentum remains muted. A confirmed 4-hour close above $116K could invite a short-term breakout toward $120K, while a breakdown below $108K would likely shift sentiment bearish again, targeting the $102K–$104K liquidity zone.
Until either boundary gives way, Bitcoin is likely to remain range-bound, with short-term traders capitalizing on intraday volatility while higher timeframes await confirmation of trend direction.
On-chain Analysis
By Shayan
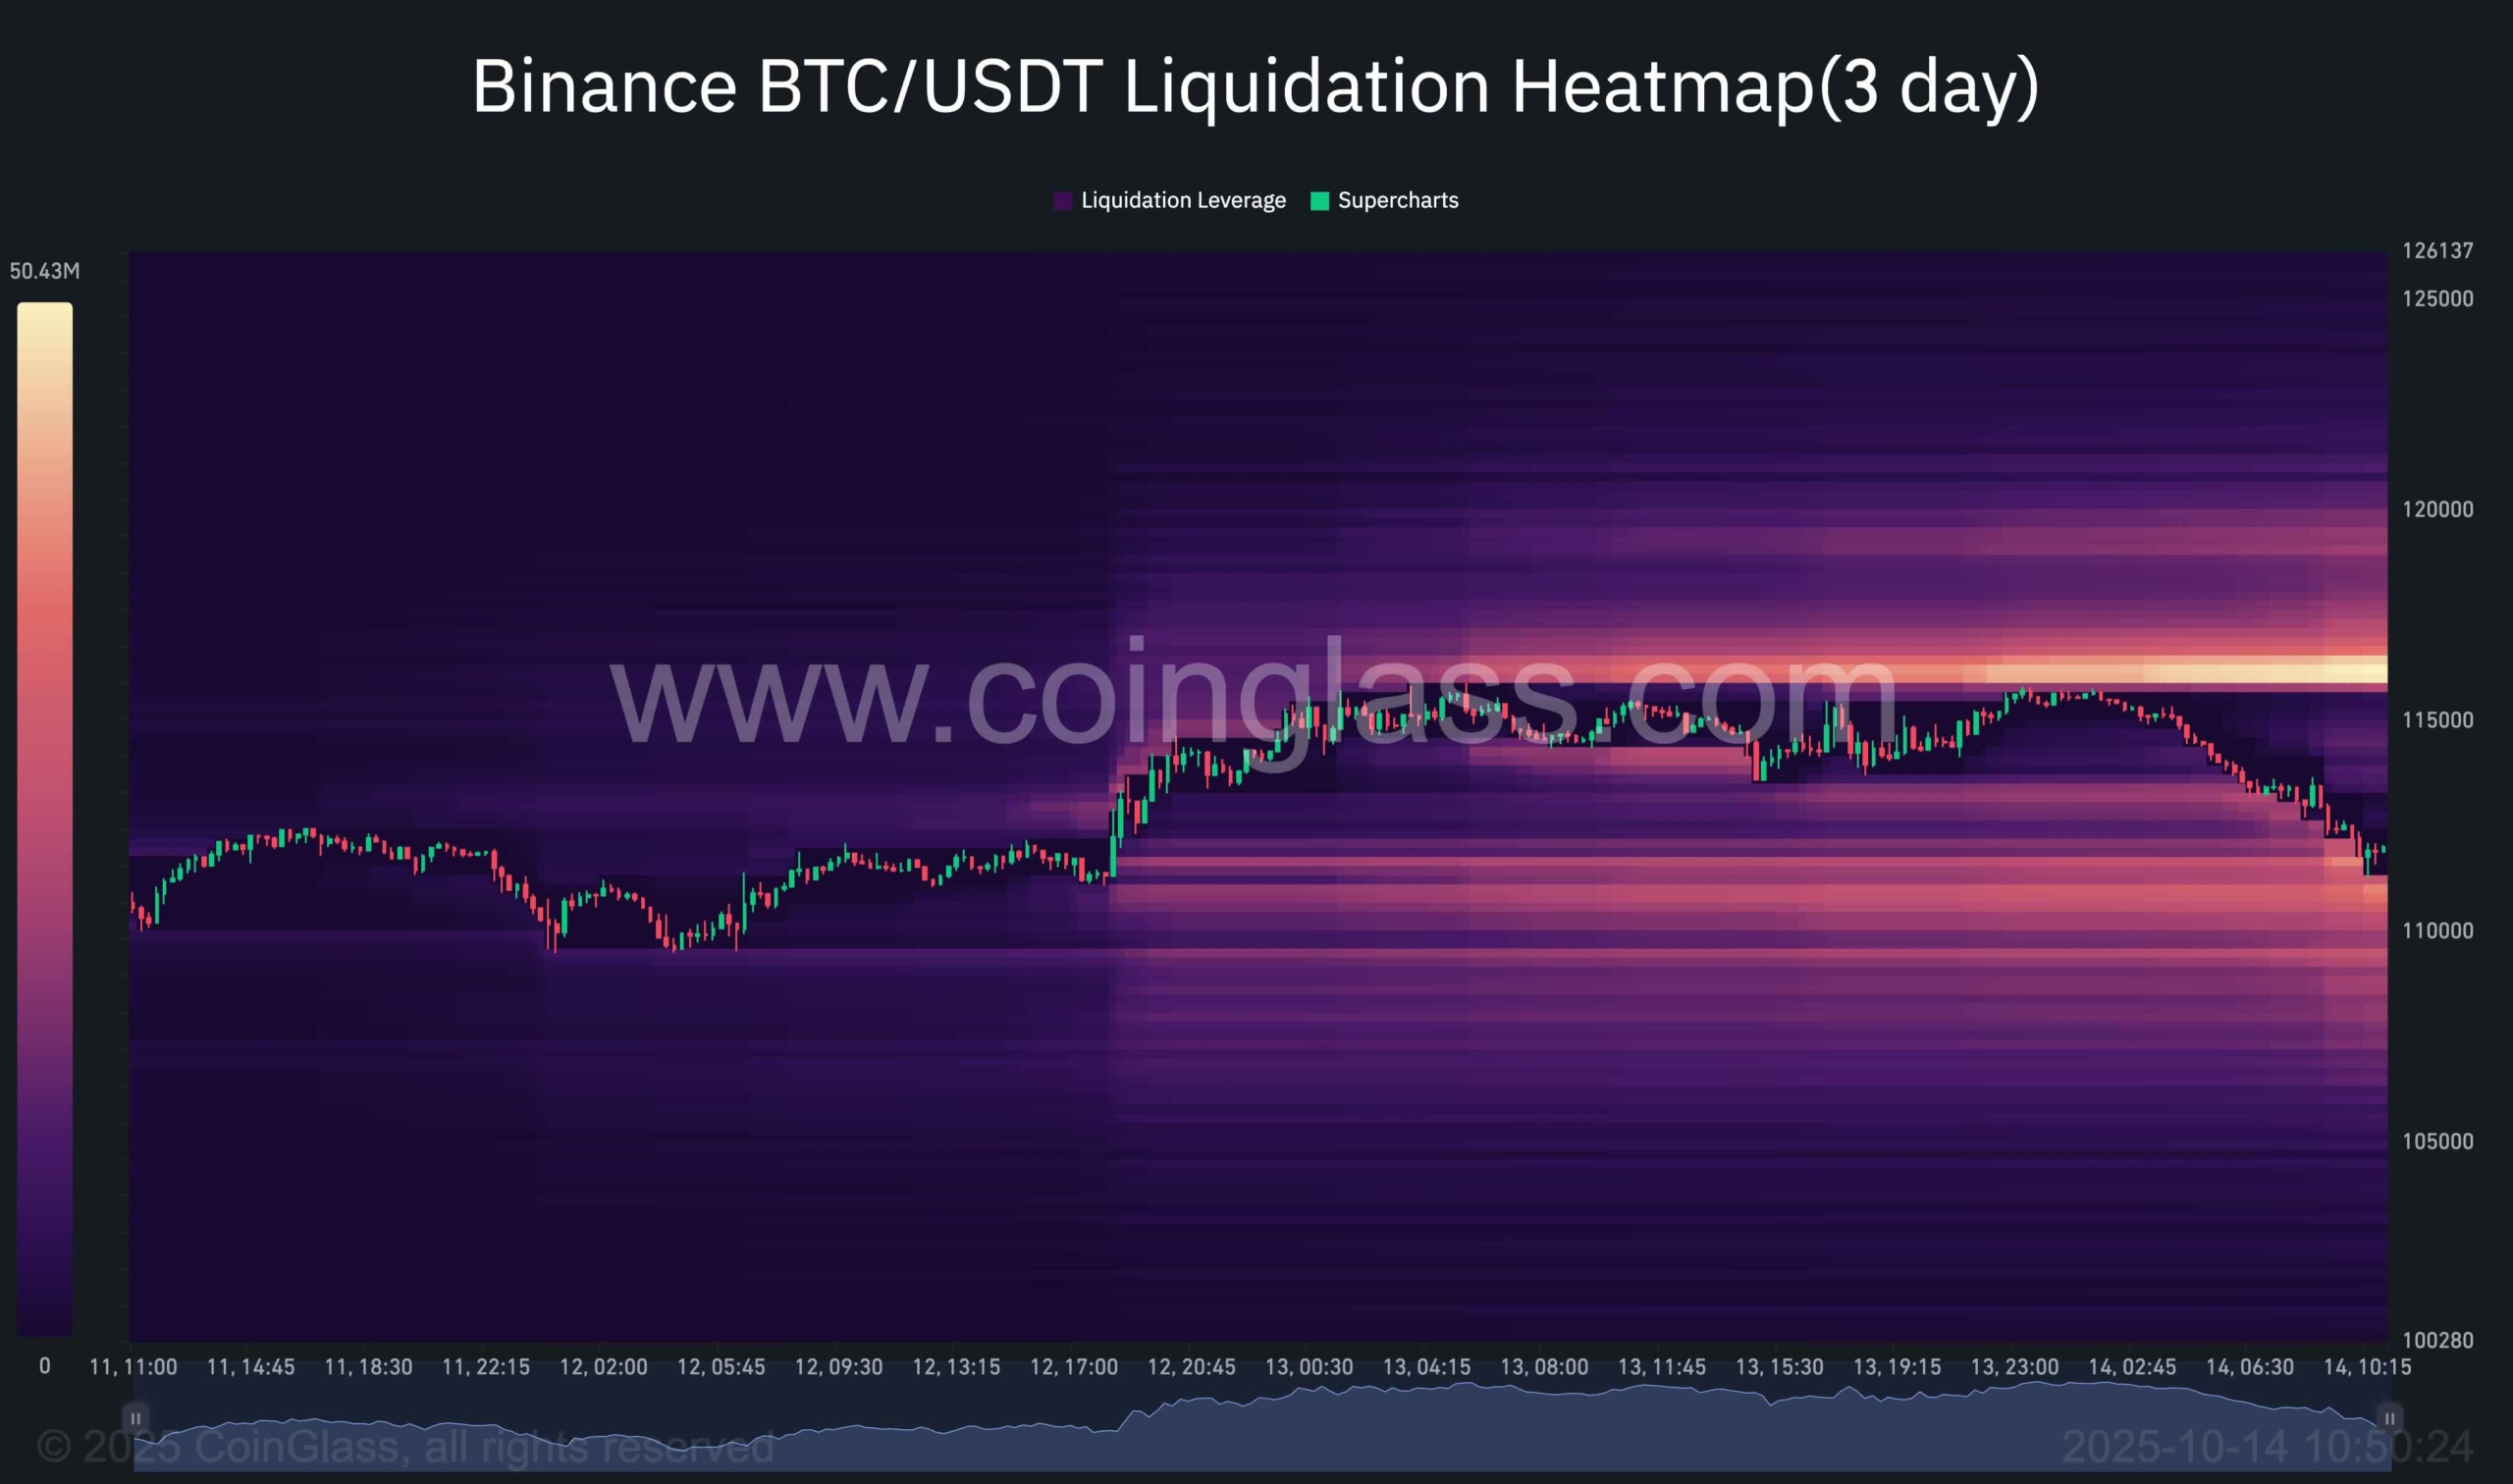
The 3-day Binance liquidation heatmap indicates that a dense liquidity pocket has developed between $115K and $118K, directly above the current market price. This area corresponds to resting short liquidations, suggesting that if Bitcoin reclaims the mid-range, a quick move to absorb this liquidity could follow.
Below current levels, the $108K–$110K range shows comparatively weaker liquidation density, meaning downside liquidity has already been cleared during last week’s drop. This dynamic reinforces the idea that price may continue oscillating within the current consolidation until one of these liquidity clusters is decisively tapped.
In summary, the heatmap confirms that short-term volatility will likely remain centered around the $109K–$116K corridor, with a potential liquidity-driven breakout on the horizon once one side of the range is cleared.
The post Bitcoin Price Analysis: Is BTC Out of the Woods Completely After Recent Meltdown? appeared first on CryptoPotato.