
Bitcoin is still under pressure across the higher time frame despite stabilizing above recent swing lows. While the short-term structure has shifted into consolidation, the broader trend continues to favor sellers unless BTC can reclaim several key resistance levels.
Meanwhile, futures market data shows aggressive market buying beginning to return, potentially laying the groundwork for a relief rally if the price confirms the move.
Bitcoin Price Analysis: The Daily Chart
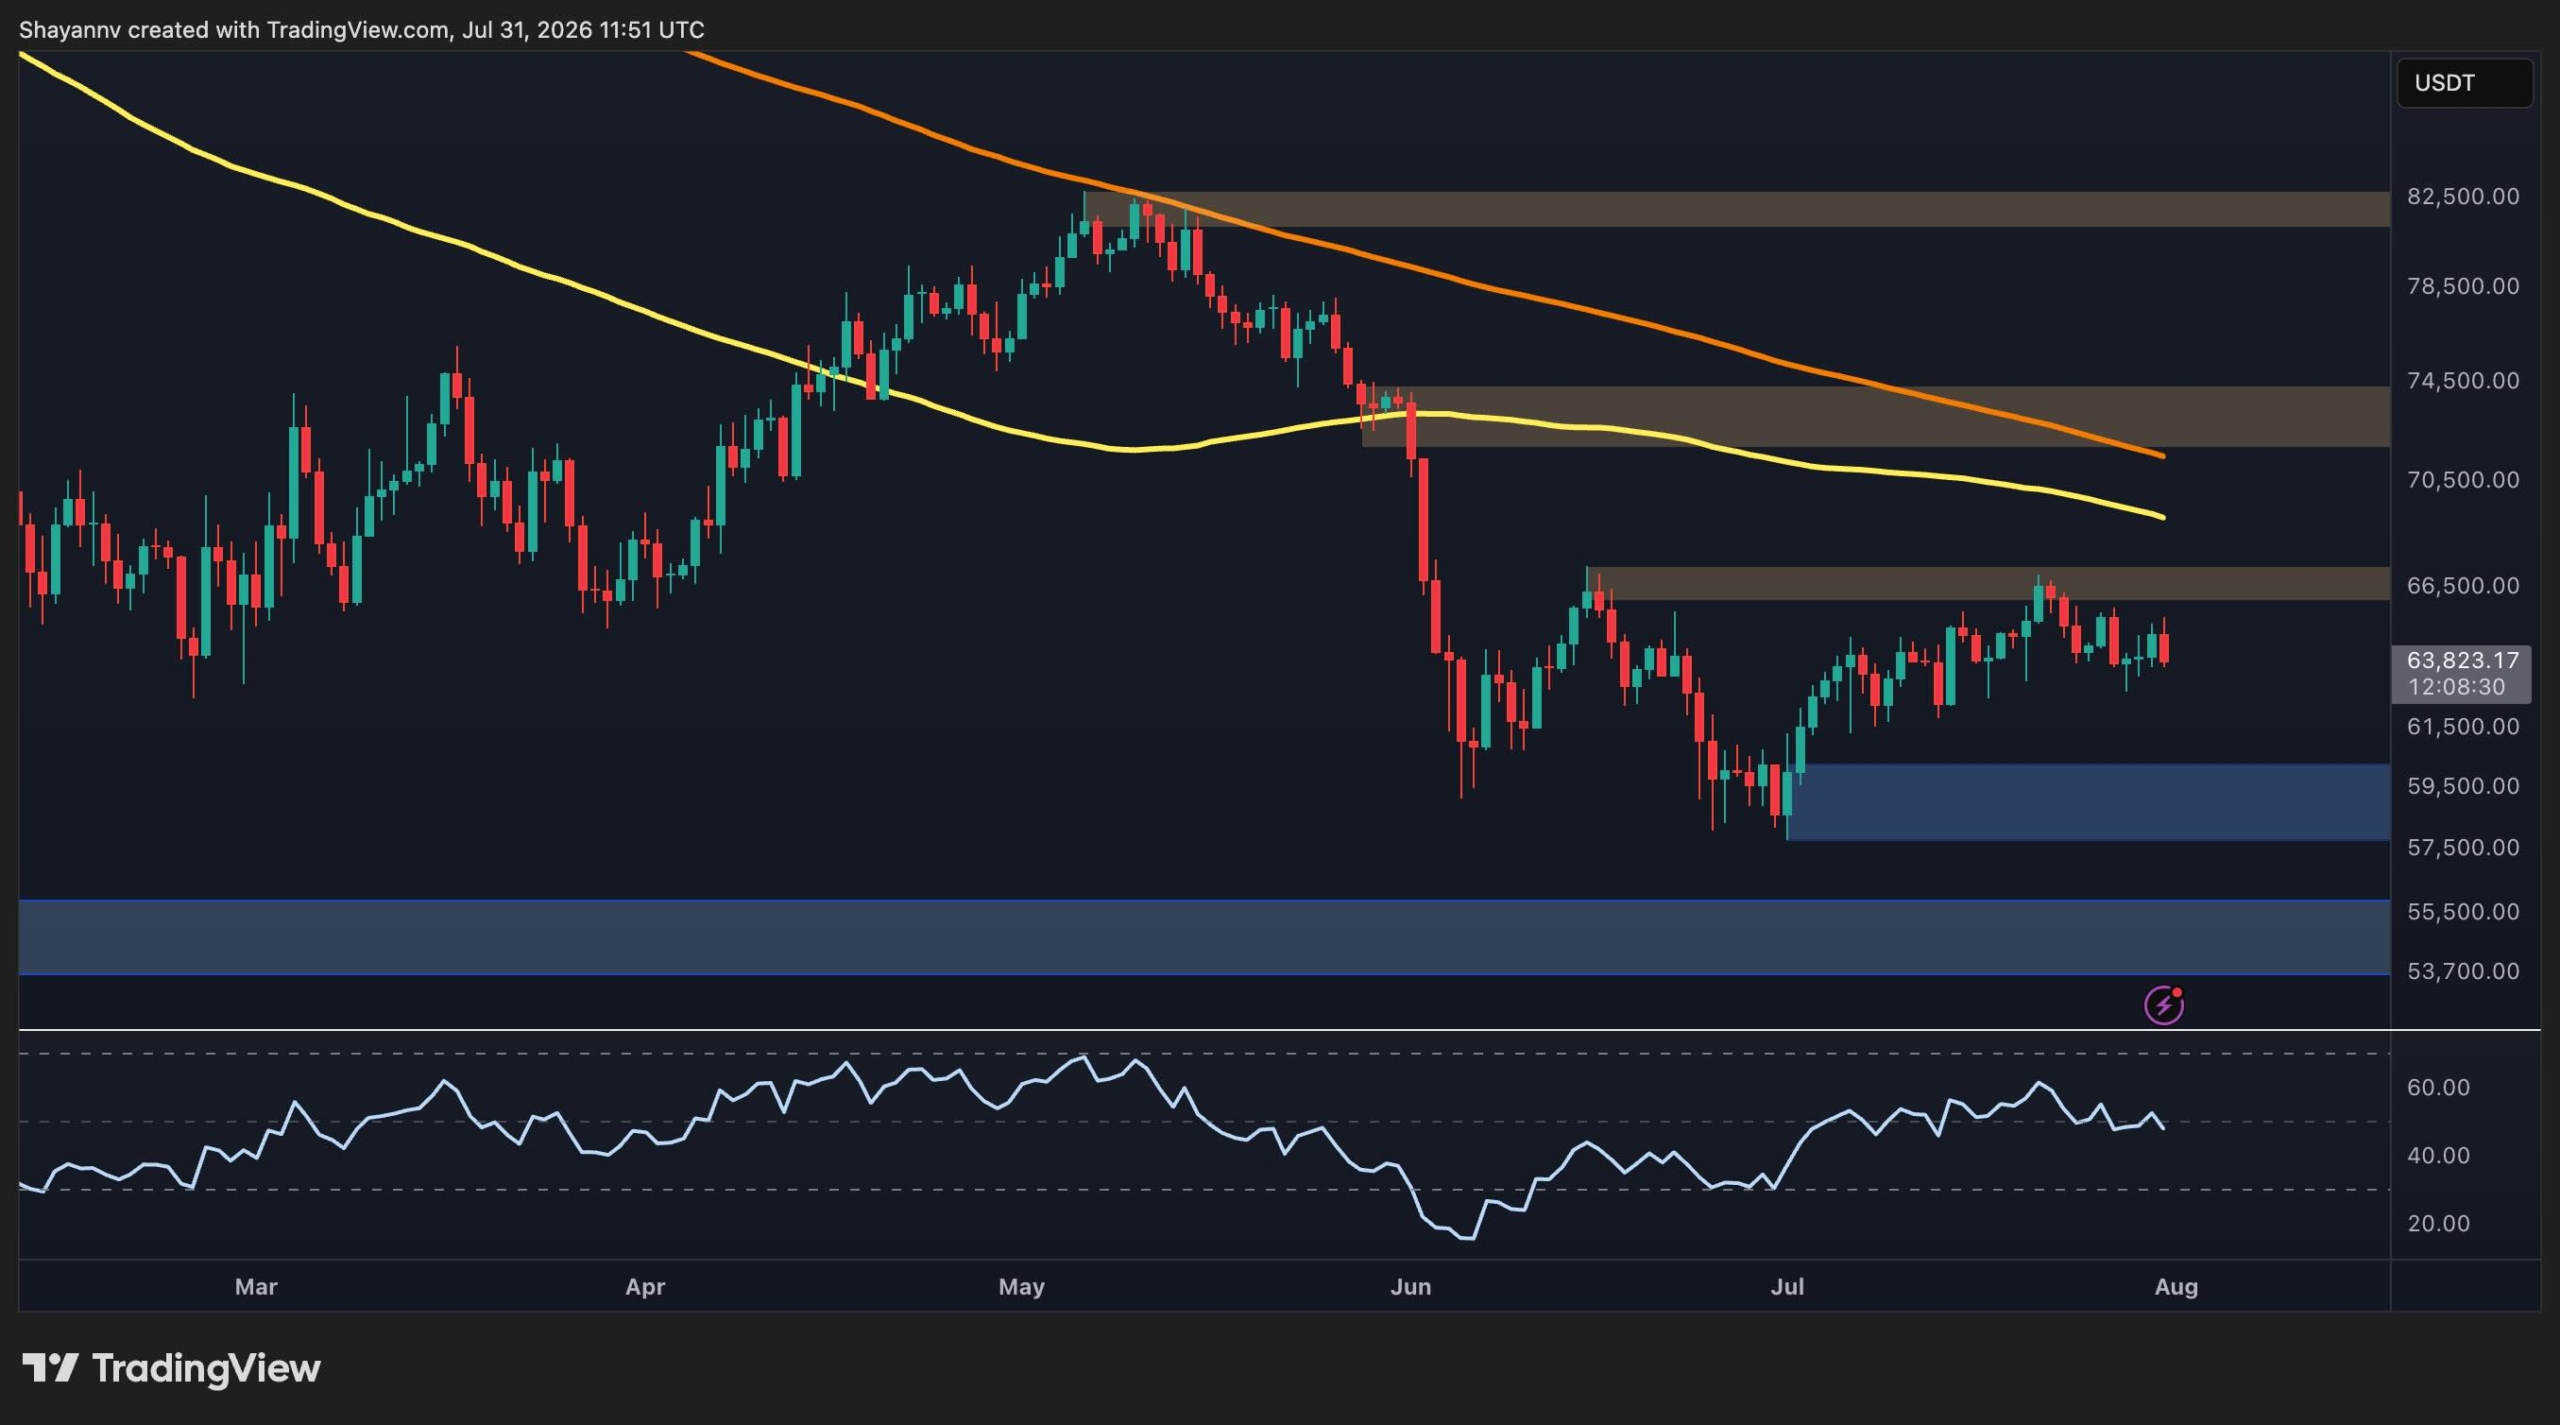
The daily chart shows BTC trading around $63.3K after its sharp late May breakdown from the $74K region. The selloff pushed the asset well below both the 100-day moving average, currently around $69K, and the 200-day moving average near $71K, leaving the broader market structure bearish.
Since the decline, BTC has entered a sideways consolidation between roughly $60K and $67K. Buyers have repeatedly defended the lower boundary of this range, while the $67K resistance zone continues to cap every recovery attempt.
Beyond the major resistance at $67K, the confluence of the 200-day moving average and the $72K to $74K supply zone is the next potential target, if an upside move materializes. A successful reclaim of those levels would improve the medium-term outlook and could expose the next resistance around $82.5K.
On the downside, immediate support remains around $60K. Losing this level would likely shift attention toward the broader support area around $54K if selling pressure accelerates, which will make the bear market both longer and deeper.
BTC/USDT 4-Hour Chart
The 4-hour timeframe shows Bitcoin consolidating after breaking below a rising channel that had supported the recovery throughout July. The channel breakdown suggests that bullish momentum has weakened and that the recent advance has transitioned into a corrective phase.
The price is currently testing the short-term support around $63K to $63.5K after rejecting the $65K resistance area. As long as this support holds, BTC could continue ranging inside this zone or potentially have another go at the $65K resistance in the coming weeks. On the other hand, a decisive breakdown below $63K would likely increase the probability of another move toward the previous demand zone around $60K.
On the upside, reclaiming the resistance area around $65K to $65.5K would be the first indication that buyers are regaining control, with the broader resistance near $67K remaining the key hurdle for a stronger recovery.

Sentiment Analysis
The Taker Buy Sell Ratio offers insight into whether market participants are executing more aggressive buy orders or sell orders. Values above 1 generally indicate buyers are taking the initiative, while readings below 1 suggest sellers remain dominant.
Although Bitcoin’s price has remained trapped near $64K, the 100-period EMA of the Taker Buy Sell Ratio has climbed above the neutral 1.0 level and continues to hold above the threshold. This divergence indicates that aggressive buying activity has strengthened even as price has failed to respond meaningfully.
Historically, sustained periods where taker buying leads while price consolidates can precede stronger directional moves if spot demand eventually absorbs overhead supply. While this does not guarantee an immediate breakout, it suggests underlying demand is improving beneath the surface.
For now, this bullish futures signal still requires confirmation from price. A break above the $67K resistance zone would align improving order flow with bullish price action, while a loss of the $60K support area would invalidate the near-term constructive outlook despite the positive shift in taker behavior, and potentially lead to another long liquidation cascade.

The post Bitcoin Price Analysis: Is BTC Heading Below $60K After the Latest Rejection? appeared first on CryptoPotato.