
Bitcoin has reclaimed the $80K area and broken out of the descending structure that had contained price throughout the bearish trend. With BTC trading at $85K, momentum has accelerated, while the latest miner reserve data suggests that the aggressive distribution seen over the previous period has started to ease.
Bitcoin Price Analysis: The Daily Chart
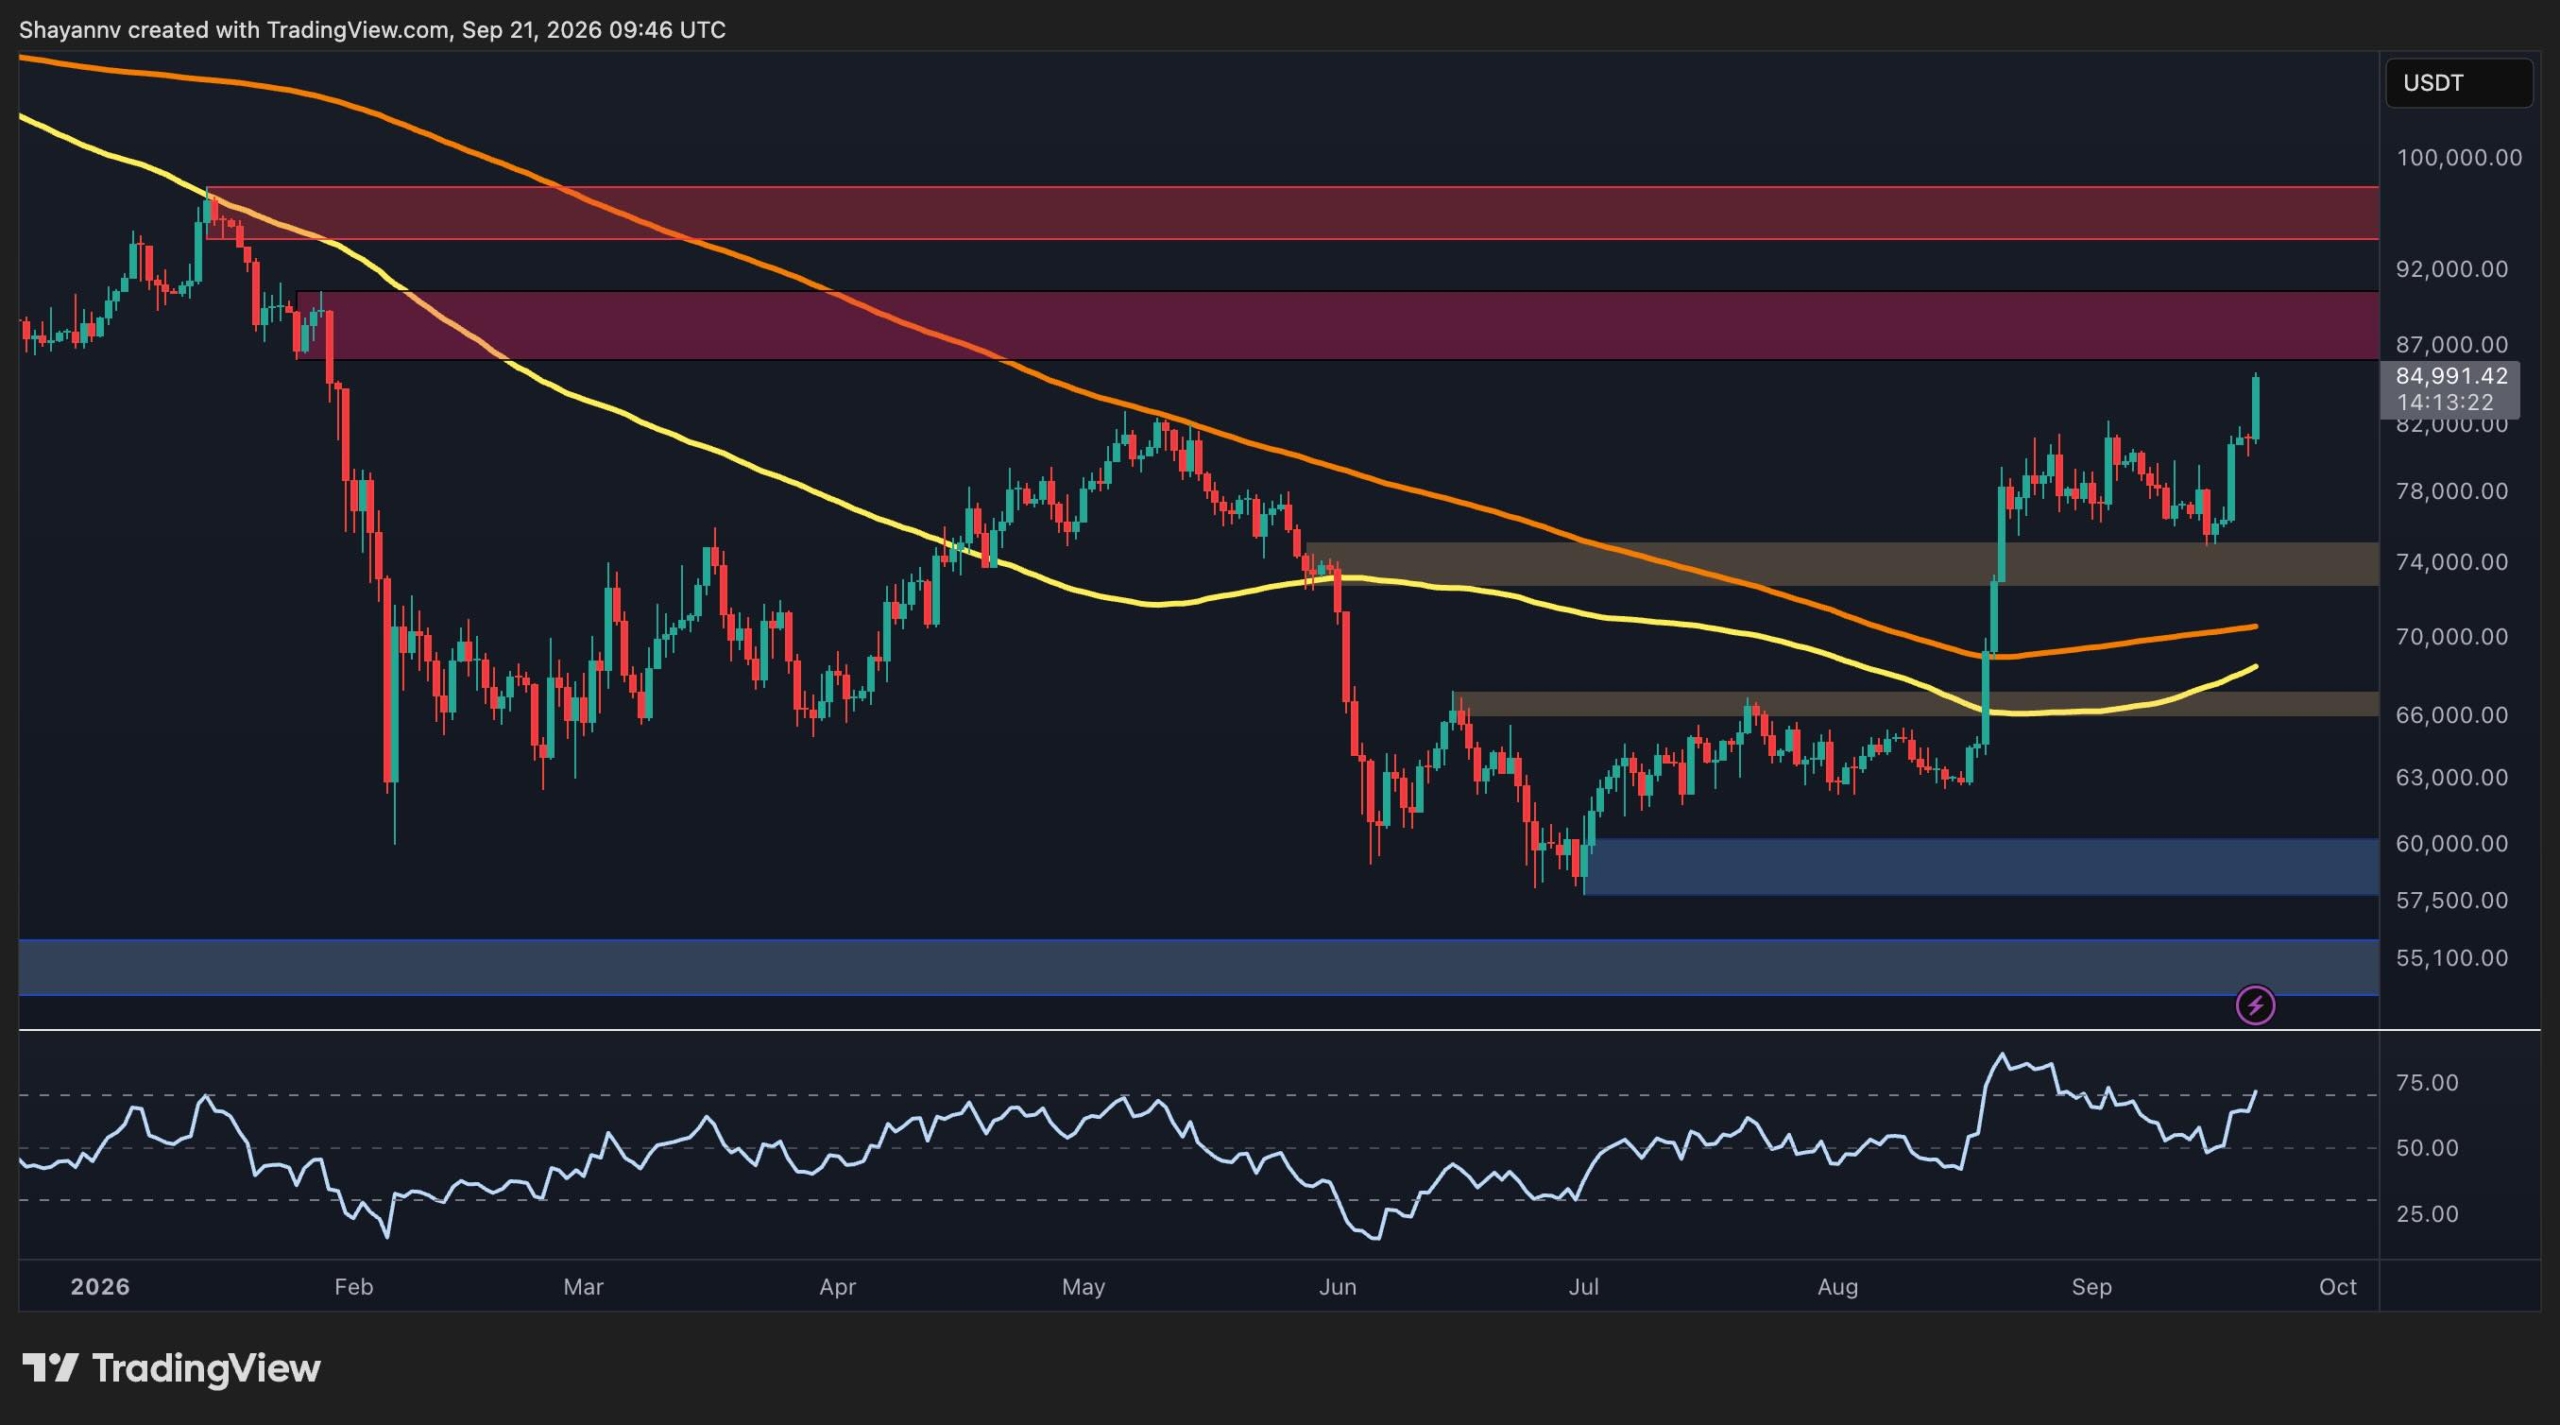
The daily chart shows a notable improvement in Bitcoin’s broader market structure. After spending much of the year below the major moving averages, BTC has reclaimed both the 100-day and 200-day moving averages and is now trading around $85K.
The move above the $74K support zone marked an important structural shift. Bitcoin subsequently consolidated for a couple of weeks, largely between $74K and $80K, before breaking higher in recent days. The latest move has now pushed BTC above the upper boundary of that consolidation and toward the $85K area.
The next major resistance is located around the $88K bearish order block. A sustained breakout above this region could expose the $95K area, which represents the next significant resistance visible on the chart.
On the downside, the $80K region has become an important level to watch following the breakout. If BTC holds above this area during a potential retest, it would support the continuation structure. Conversely, a decisive move back below it could signal a failed breakout and bring the $74K range back into focus.
The daily RSI has also strengthened considerably and is approaching the 75 region. This confirms the improvement in momentum, although it also indicates that the market is becoming increasingly stretched in the short term.
BTC/USDT 4-Hour Chart
The 4-hour chart provides a clearer picture of the recent breakout. BTC had been trading inside a descending channel, with both the upper and lower boundaries gradually moving lower. The price eventually broke above the channel and reclaimed the $80K-$82K resistance zone.
The breakout has since accelerated, with BTC reaching approximately $85K. The immediate focus is now on the $88K area, which is a visible order block on the higher-timeframe chart.
Momentum is particularly strong, with the 4-hour RSI around 80. While elevated RSI readings do not necessarily invalidate a breakout, they do increase the possibility of short-term consolidation or a retest after the sharp advance.
The $80K-$82K zone is therefore likely to be the key near-term support. Holding this area would keep the recent breakout structure intact, while a sustained move back below it could indicate that BTC needs a deeper correction before attempting another move higher.

On-Chain Analysis
Bitcoin’s miner reserve chart shows a clear change in the pace of miner distribution. Reserves declined aggressively throughout much of 2024 and continued trending lower into 2025 and the earlier part of 2026. The miner reserve 30-day EMA also followed a persistent downward trajectory during this period, reflecting a prolonged reduction in the amount of BTC held by miners.
However, the trend has become noticeably more stable in recent months. The miner reserve has largely moved sideways around the $1.19M BTC area, with the 30-day EMA having flattened considerably compared with its earlier decline.
This stabilization suggests that the aggressive distribution from miners has slowed. Rather than continuing to reduce reserves at the same pace seen previously, miners appear to be maintaining a relatively more stable level of BTC holdings.
The timing is notable as Bitcoin has simultaneously recovered toward the $85K area. A combination of improving price action and slowing miner distribution could remove some of the persistent sell-side pressure that characterized the earlier period. While the chart alone does not confirm outright miner accumulation, the stabilization in reserves represents a meaningful change from the aggressive depletion observed previously.
For Bitcoin’s broader market structure, continued stabilization or a reversal higher in miner reserves would therefore be an important development to monitor.

The post Bitcoin Price Prediction: Is $90K Next After BTC’s Explosive $10K Rally? appeared first on CryptoPotato.