Ethereum continues to consolidate between institutional zones, with clear boundaries defined by $3.4K support and $4.6K resistance. The current symmetrical triangle formation signals a period of compression, with breakout potential in either direction.
Technical Analysis
By Shayan
The Daily Chart
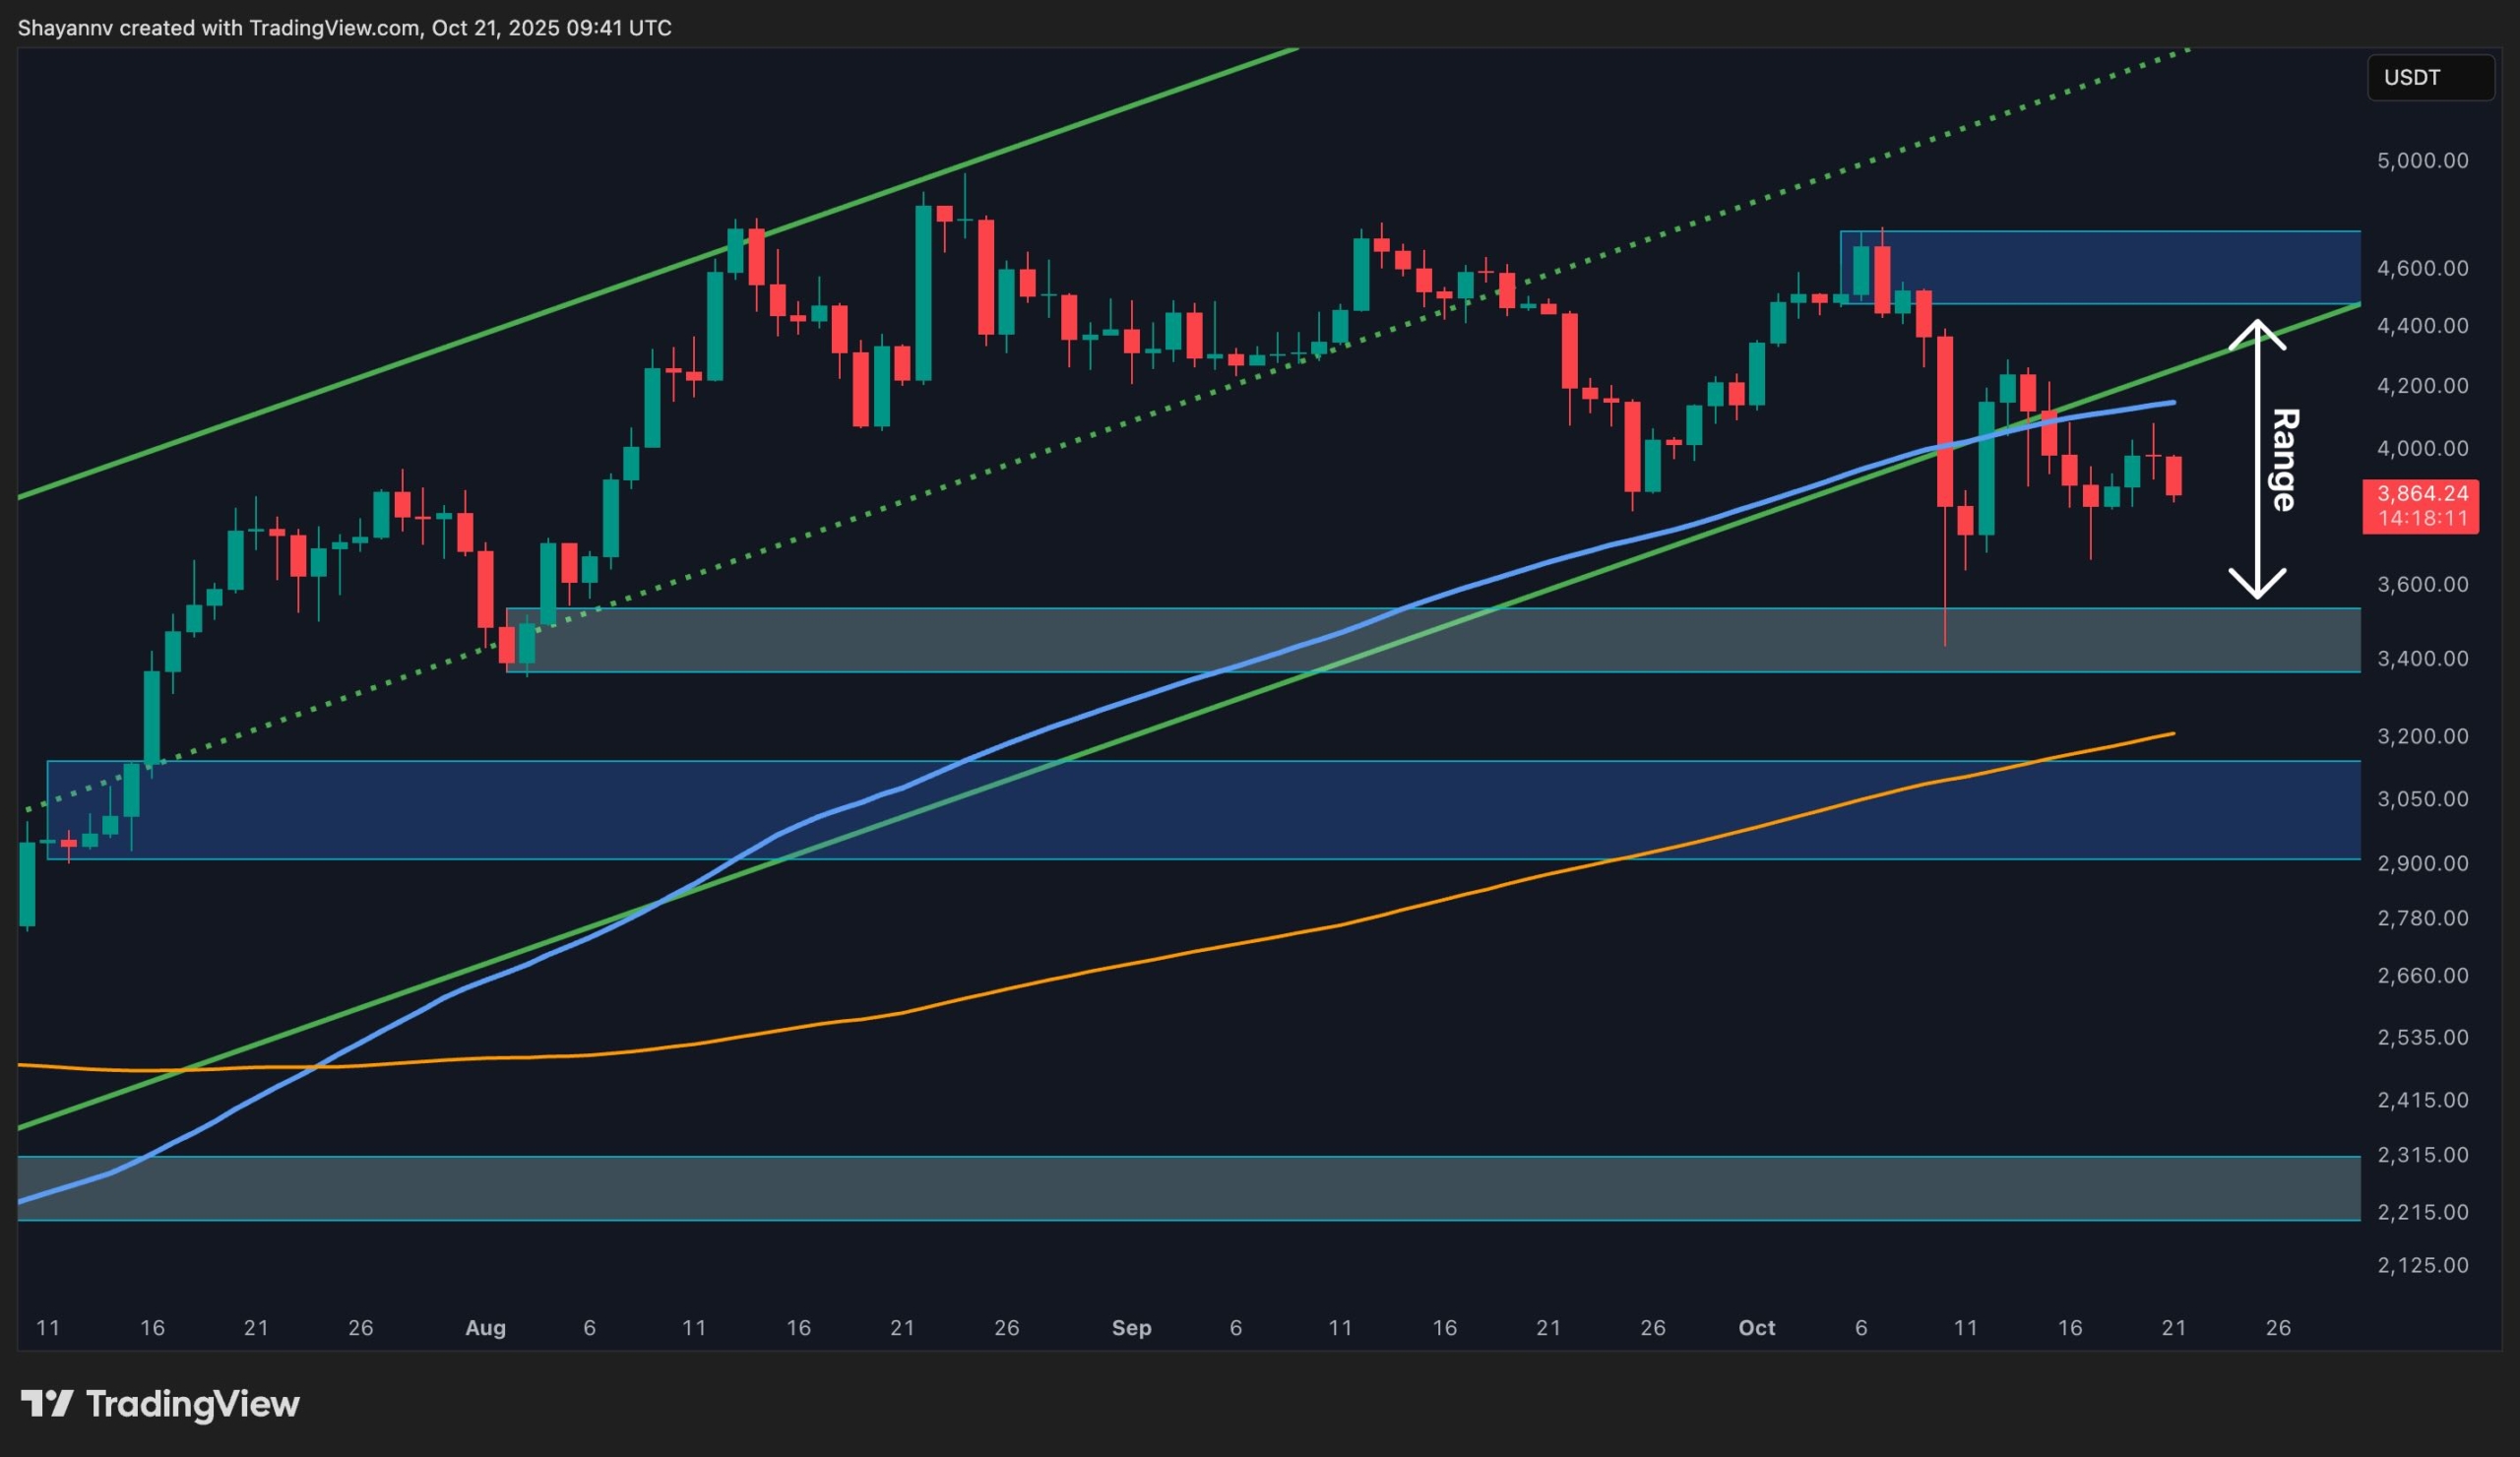
On the daily timeframe, ETH remains trapped in a mid-range structure between the $3.4K institutional demand zone and the $4.6K supply zone. The rejection from $4.2K coincided with a retest of the broken ascending trendline and the 100-day moving average, both now acting as resistance levels.
Momentum has slowed, and ETH is currently ranging near the midline of its broader range and below the 100-day MA. The 200-day MA around $3.1K continues to serve as the final dynamic support, while the $3.4K demand zone, a level that absorbed liquidity during the Trump tariff crash, has repeatedly attracted buying interest.
For ETH to regain bullish momentum, the price must close decisively above $4.2K, reclaiming the mid-range and setting up a move toward $4.6K. Until that happens, the broader structure remains neutral to slightly bullish, supported by the long-term ascending trend and institutional accumulation zones below.
The 4-Hour Chart
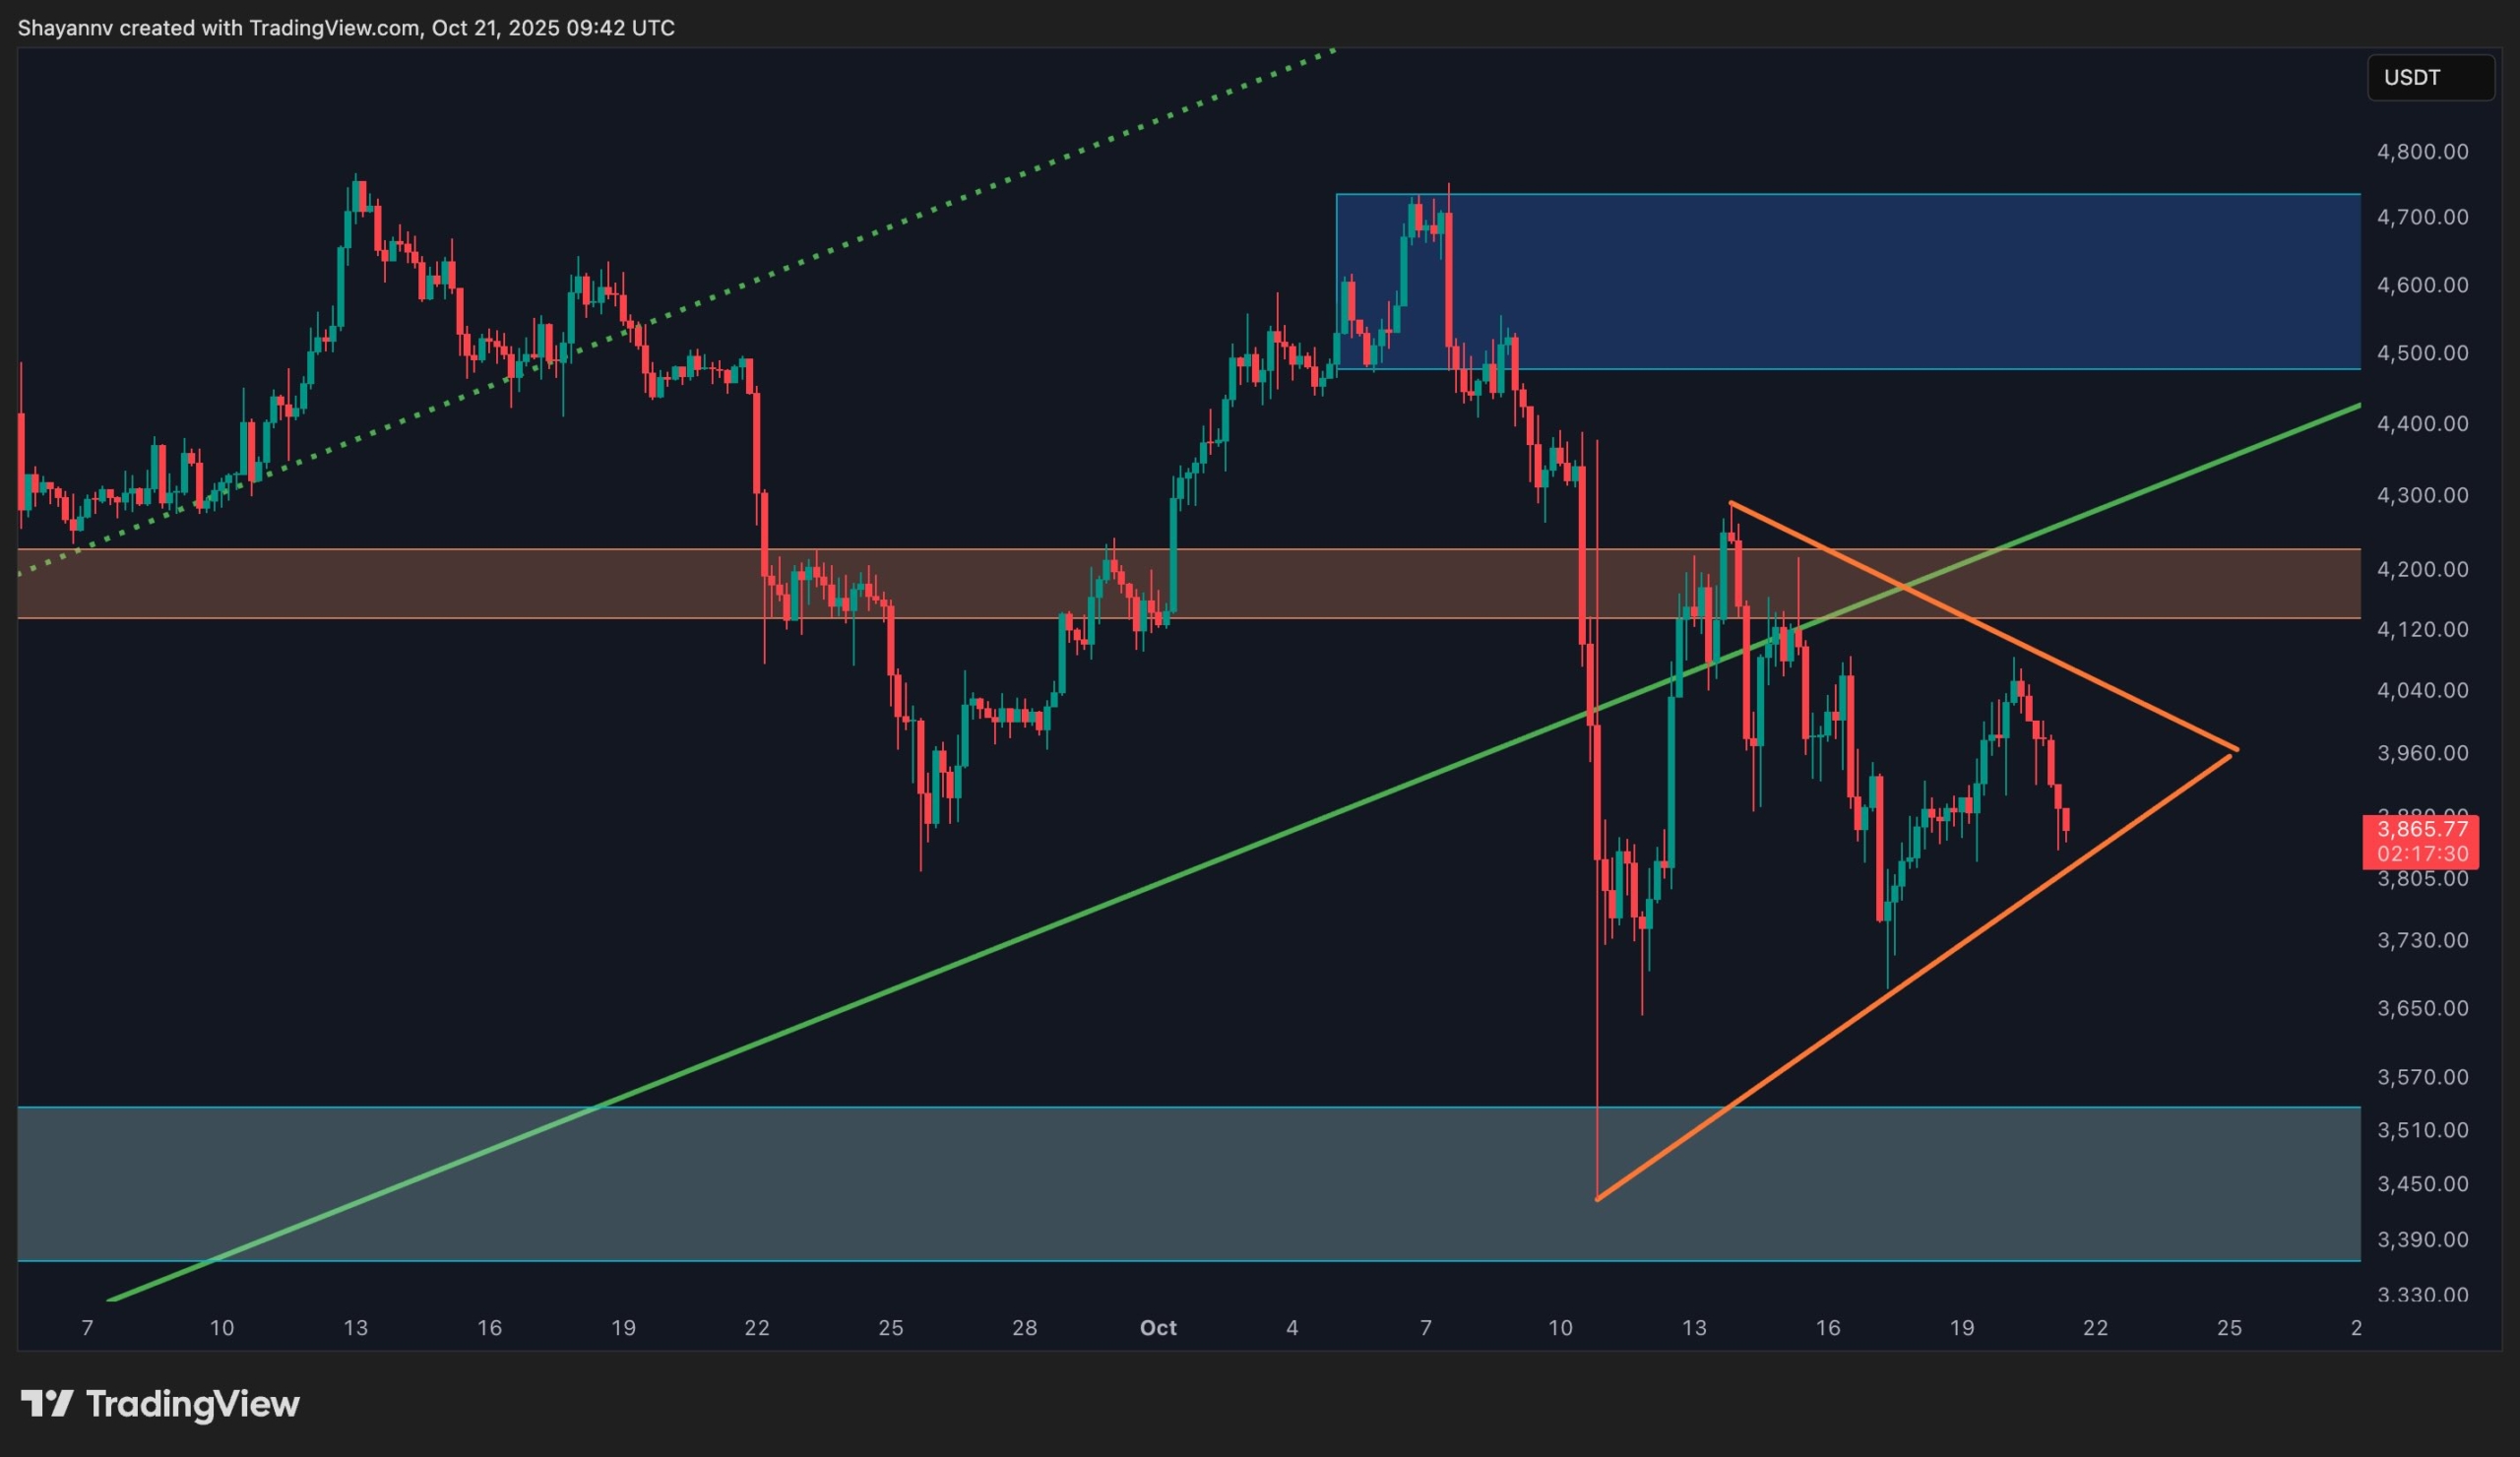
The 4-hour timeframe shows ETH forming a symmetrical triangle, reflecting market indecision following the recent selloff. The pattern’s upper boundary aligns with the $4K resistance, while the lower boundary is supported by the $3.8K short-term range floor.
This structure represents a liquidity compression phase, where volatility continues to narrow before a directional breakout. If bulls manage to break the upper trendline, a rally toward $4.4K–$4.6K would be expected, coinciding with the higher range boundary and institutional supply zone. Conversely, a breakdown below $3.7K could expose the $3.4K demand zone once again.
Until confirmation, the price is expected to oscillate within this narrowing range, a typical setup for traders waiting for volatility expansion.
Sentiment Analysis
By Shayan
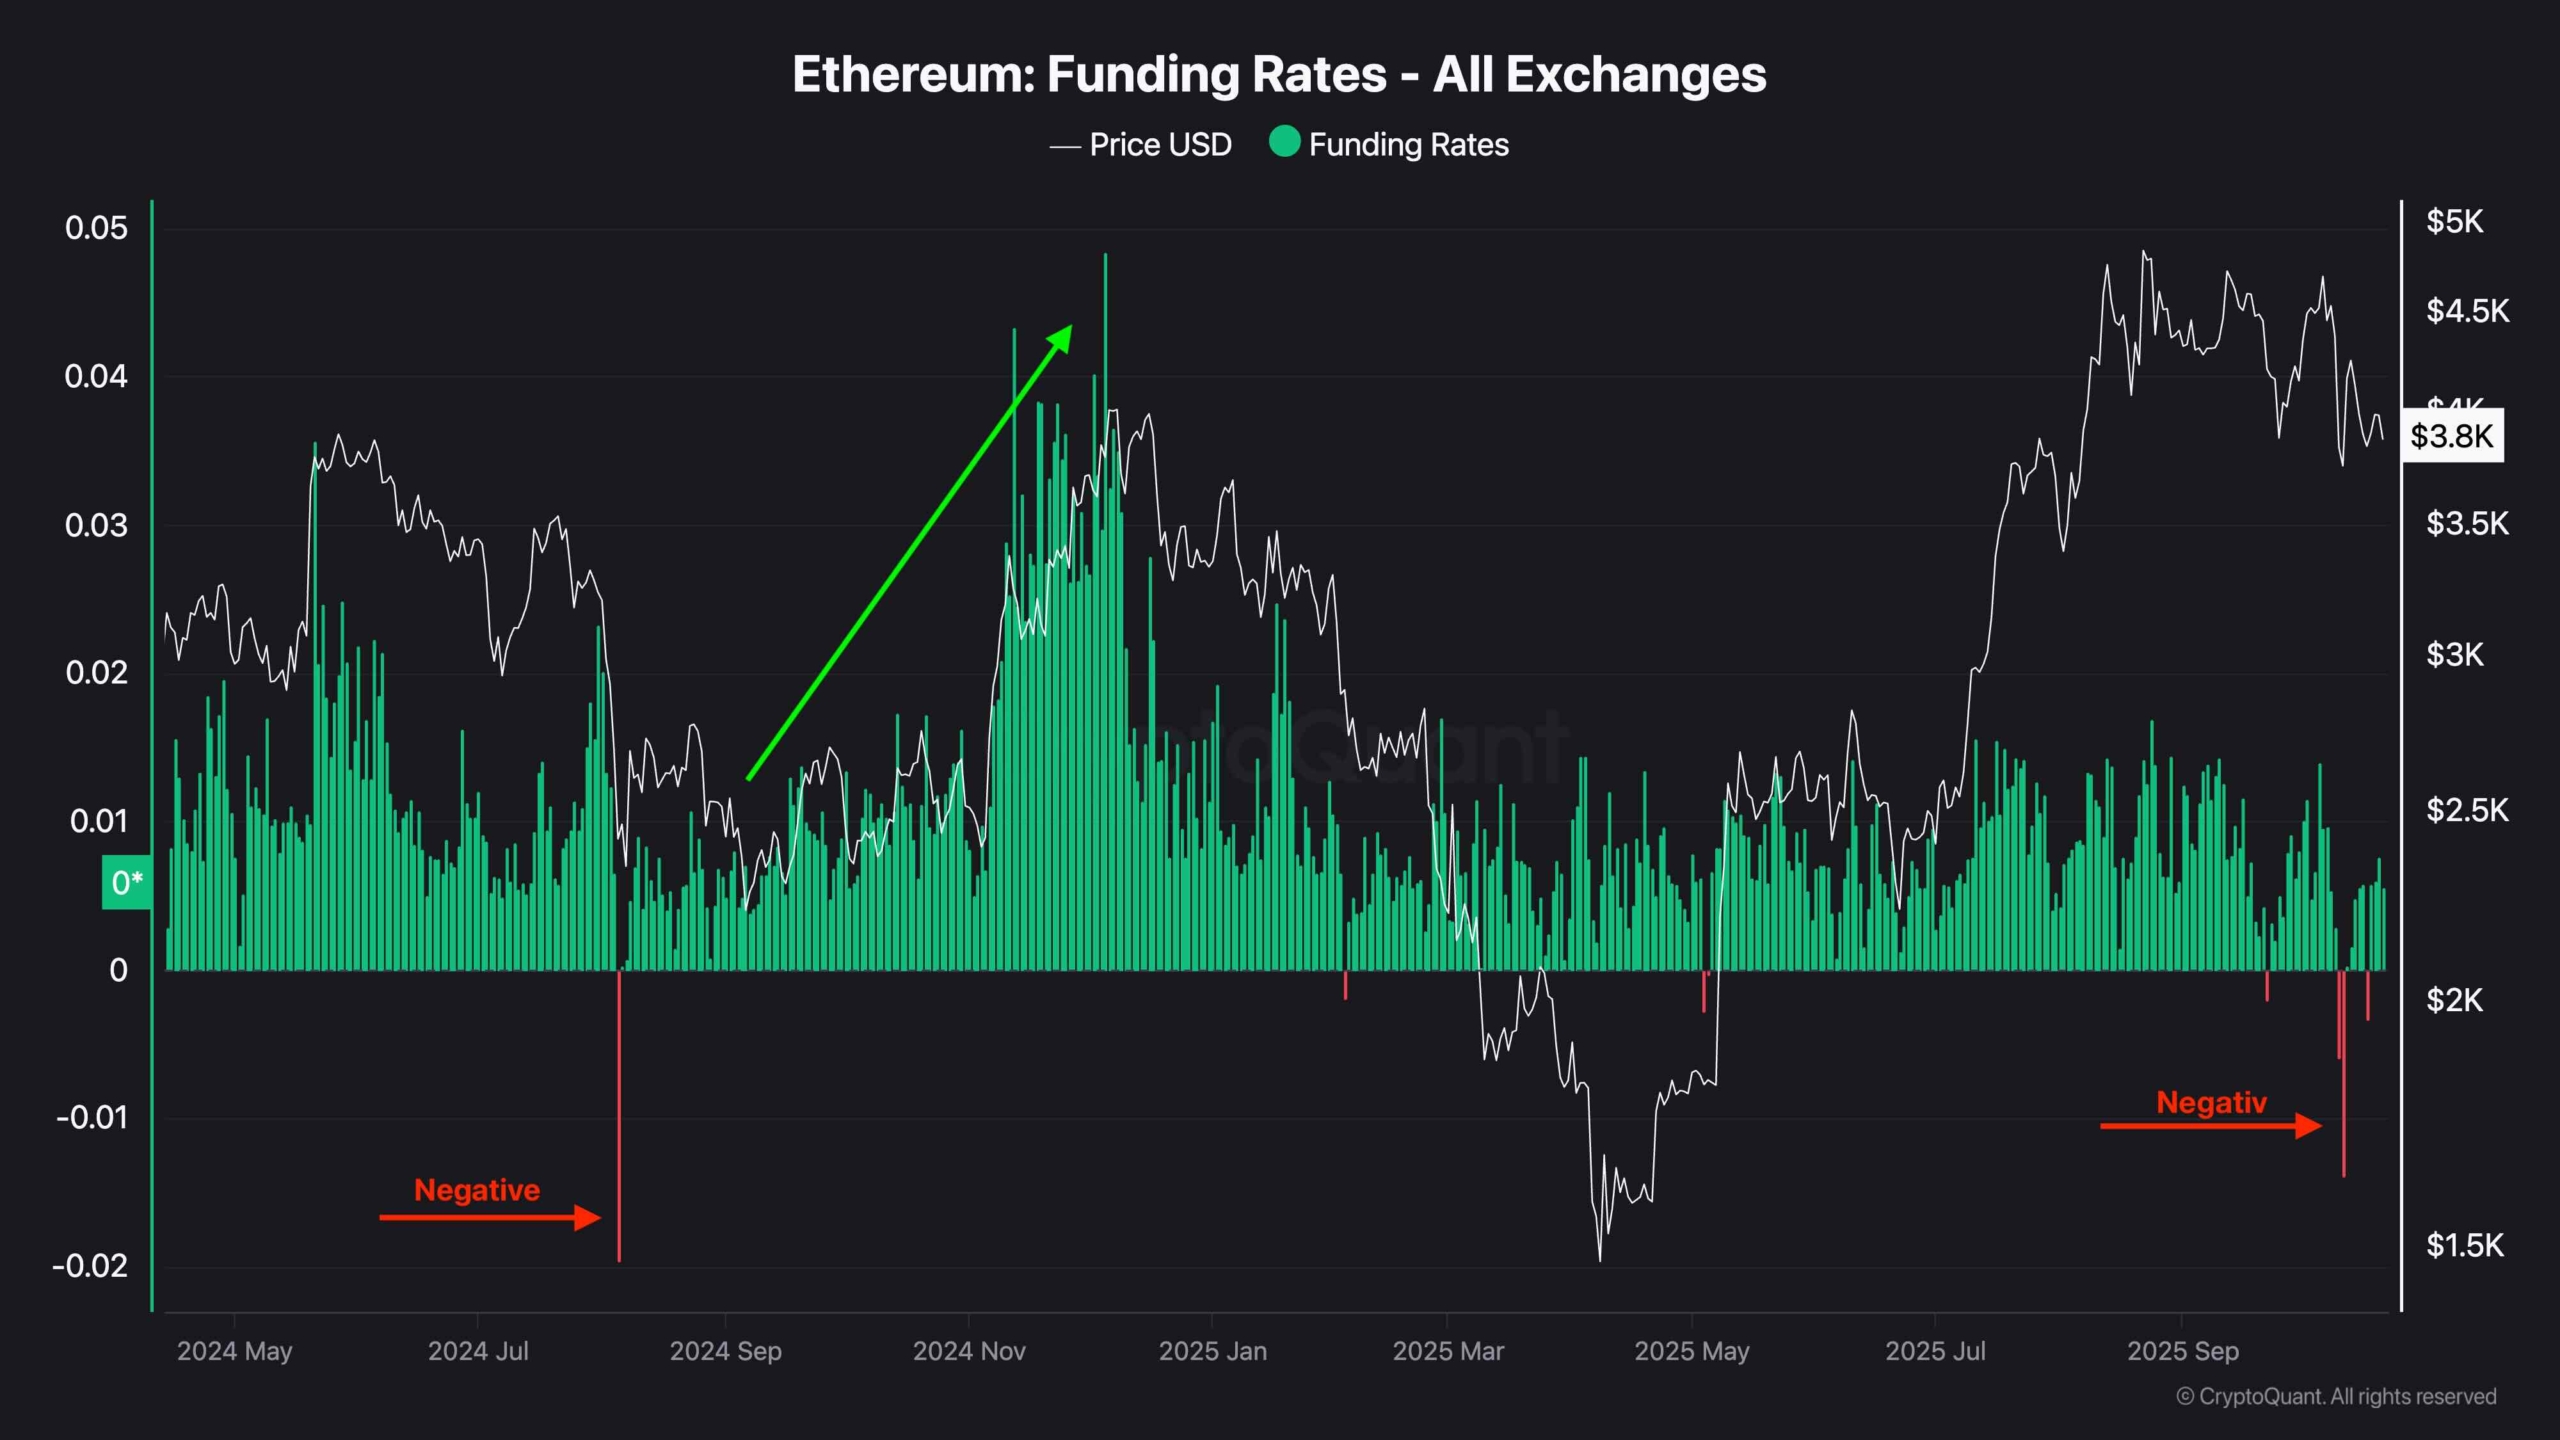
Ethereum’s funding rates across all exchanges have recently turned negative, mirroring the sentiment observed during major market bottoms in past cycles. Historically, periods of negative funding rates, when short positions dominate and perpetual traders pay a premium to hold them, have preceded sharp bullish reversals, as seen in late 2024 before the rally toward $4.8K.
The current negative readings suggest fear-driven shorting pressure, which, paradoxically, often acts as fuel for upward movements once selling exhaustion sets in. If this condition persists while ETH maintains structural support near $3.8K–$3.4K, it could set the stage for another short squeeze-driven recovery into the upper range.
The post Ethereum Price Analysis: 2 Short-Term Levels for ETH Bulls to Watch This Week appeared first on CryptoPotato.