Ethereum is trading below $2.2k to open the new week, holding above the critical $1.8k support zone but struggling to make any decisive move higher. The recovery from February’s lows has been frustratingly shallow, and with macro uncertainty still clouding the broader risk environment, ETH remains in a position where it needs to prove itself rather than simply hold ground.
Ethereum Price Analysis: The Daily Chart
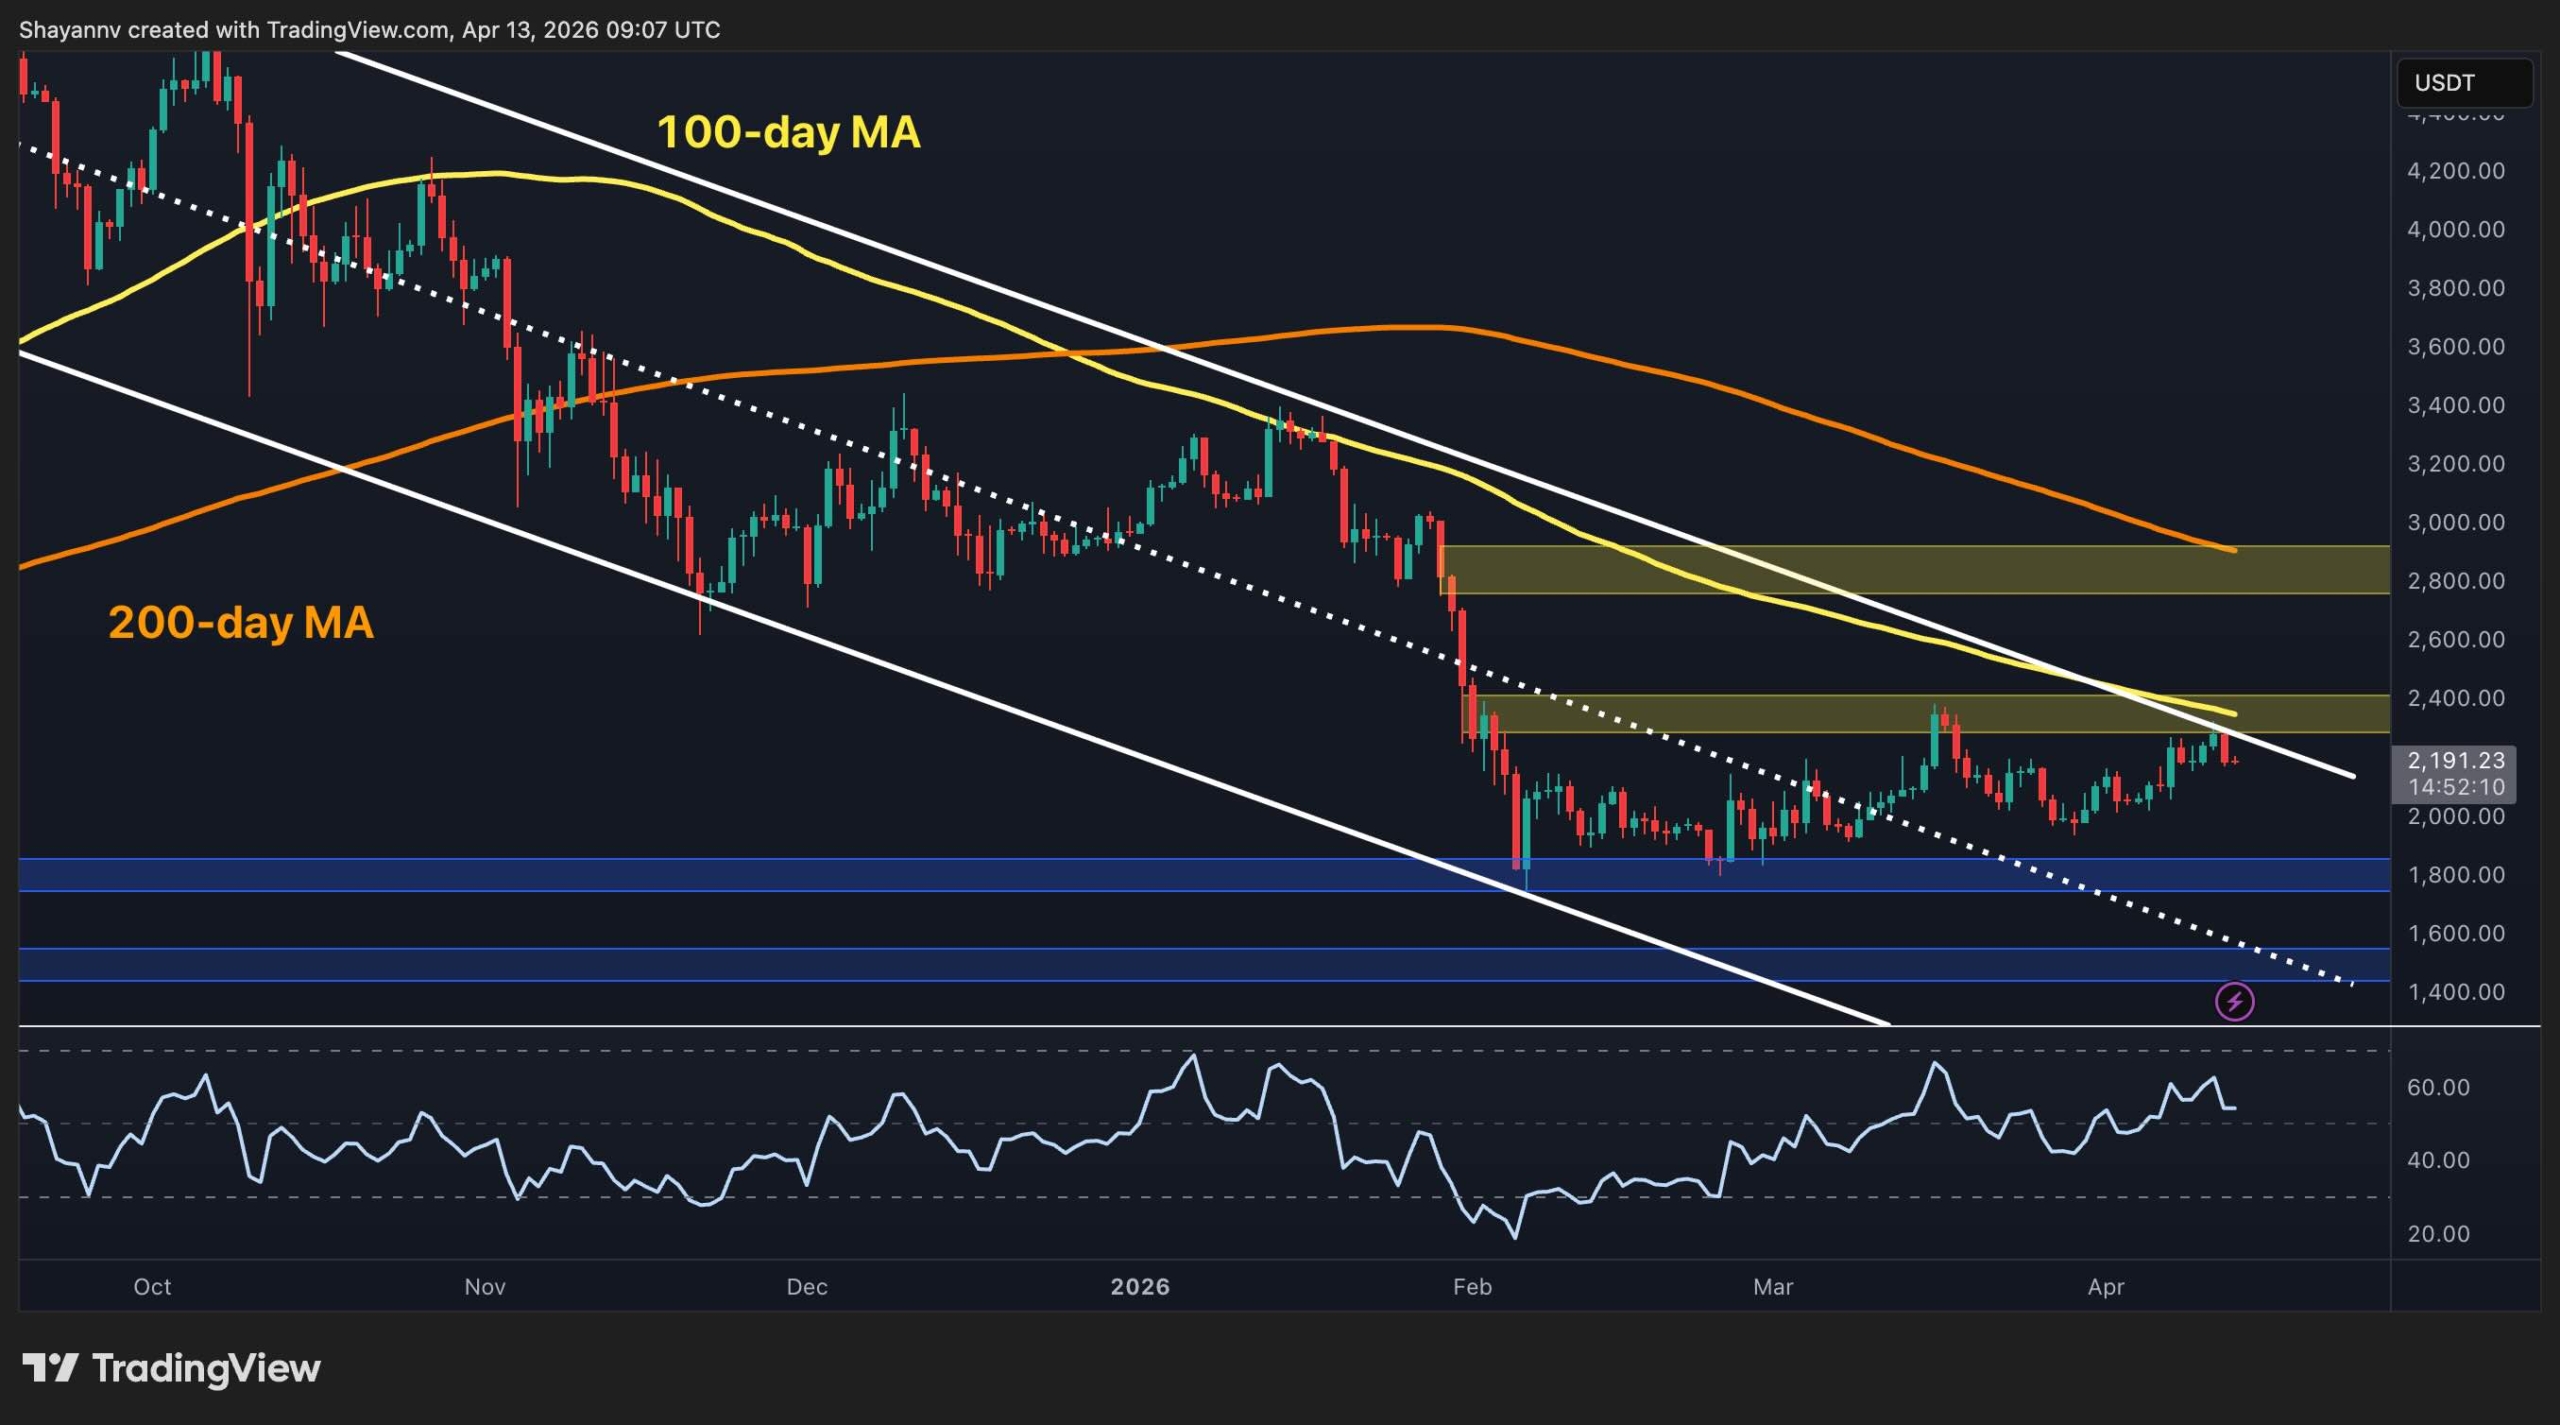
The descending channel on the daily chart remains intact, with the 100-day MA (~$2.4k) and 200-day MA (~$2.9k) both declining overhead and forming a formidable resistance ceiling. The price has been oscillating below the $2.4k supply zone for weeks now, and every push into that area has met renewed selling pressure.
What is quietly improving, however, is the RSI. The momentum oscillator has been rising since the February capitulation and is now trending in the mid-to-high 50s. That kind of momentum divergence — the price struggling to break higher while RSI steadily rises — can often precede a more forceful breakout attempt.
Currently, holding the $1.8k support band remains non-negotiable for buyers. If the asset breaks below, it would expose ETH to $1.6k and $1.5k fairly quickly. Above, $2.4k is the level that matters most, as it is the convergence of the descending channel’s higher trendline, the $2.4k supply zone, and the 100-day moving average.
ETH/USDT 4-Hour Chart
On the 4-hour timeframe, ETH has been respecting a mildly ascending trendline from the February lows. The trendline is now providing support near $2k, with the price currently at just under $2.2k after getting rejected from the upper end of the recent range. However, the $2.4k resistance zone is still within striking distance after a solid recovery over the past week.
The RSI on the 4-hour has dropped rapidly from the high-70s seen during the early April push and is now hovering around 50, which shows momentum neutrality. Yet, there is room to build in either direction.
A clean breakout above $2.4k on this timeframe, ideally accompanied by RSI holding above 60, would be the most constructive short-term development ETH has seen in months. But failure to do so keeps the range-bound structure intact and brings the ascending trendline near $2k back into focus as the next test.

Sentiment Analysis
Ethereum’s exchange supply ratio has continued its relentless decline, now sitting at 0.126, which is a multi-year low that reflects an ongoing trend of holders withdrawing ETH from exchanges into self-custody. The drop from the mid-2025 peak near 0.18 has been steep and consistent, mirroring the price correction almost in lockstep.
What makes the current reading particularly notable is the growing divergence between supply availability and price. ETH is trading near $2.1k–$2.2k while exchange-held supply is at levels not seen in the entire dataset. This means that there is structurally less ETH available to sell on exchanges. In previous cycles, sustained declines in the exchange supply ratio have happened before price recoveries once demand returned.
So, with the supply-side foundation quietly being built, the missing ingredient remains a clear catalyst to bring buyers back in sufficient size to translate that tightness into upward price movement.

The post Ethereum Price Analysis: Has ETH’s Structure Shifted Fundamentally After Surge to $2.2K? appeared first on CryptoPotato.