XRP continues to drift lower as buyers struggle to hold onto key levels. Despite past attempts at reclaiming higher ground, the structure remains weak, and sellers are beginning to take more control across both the USDT and BTC pairs.
Technical Analysis
By Shayan
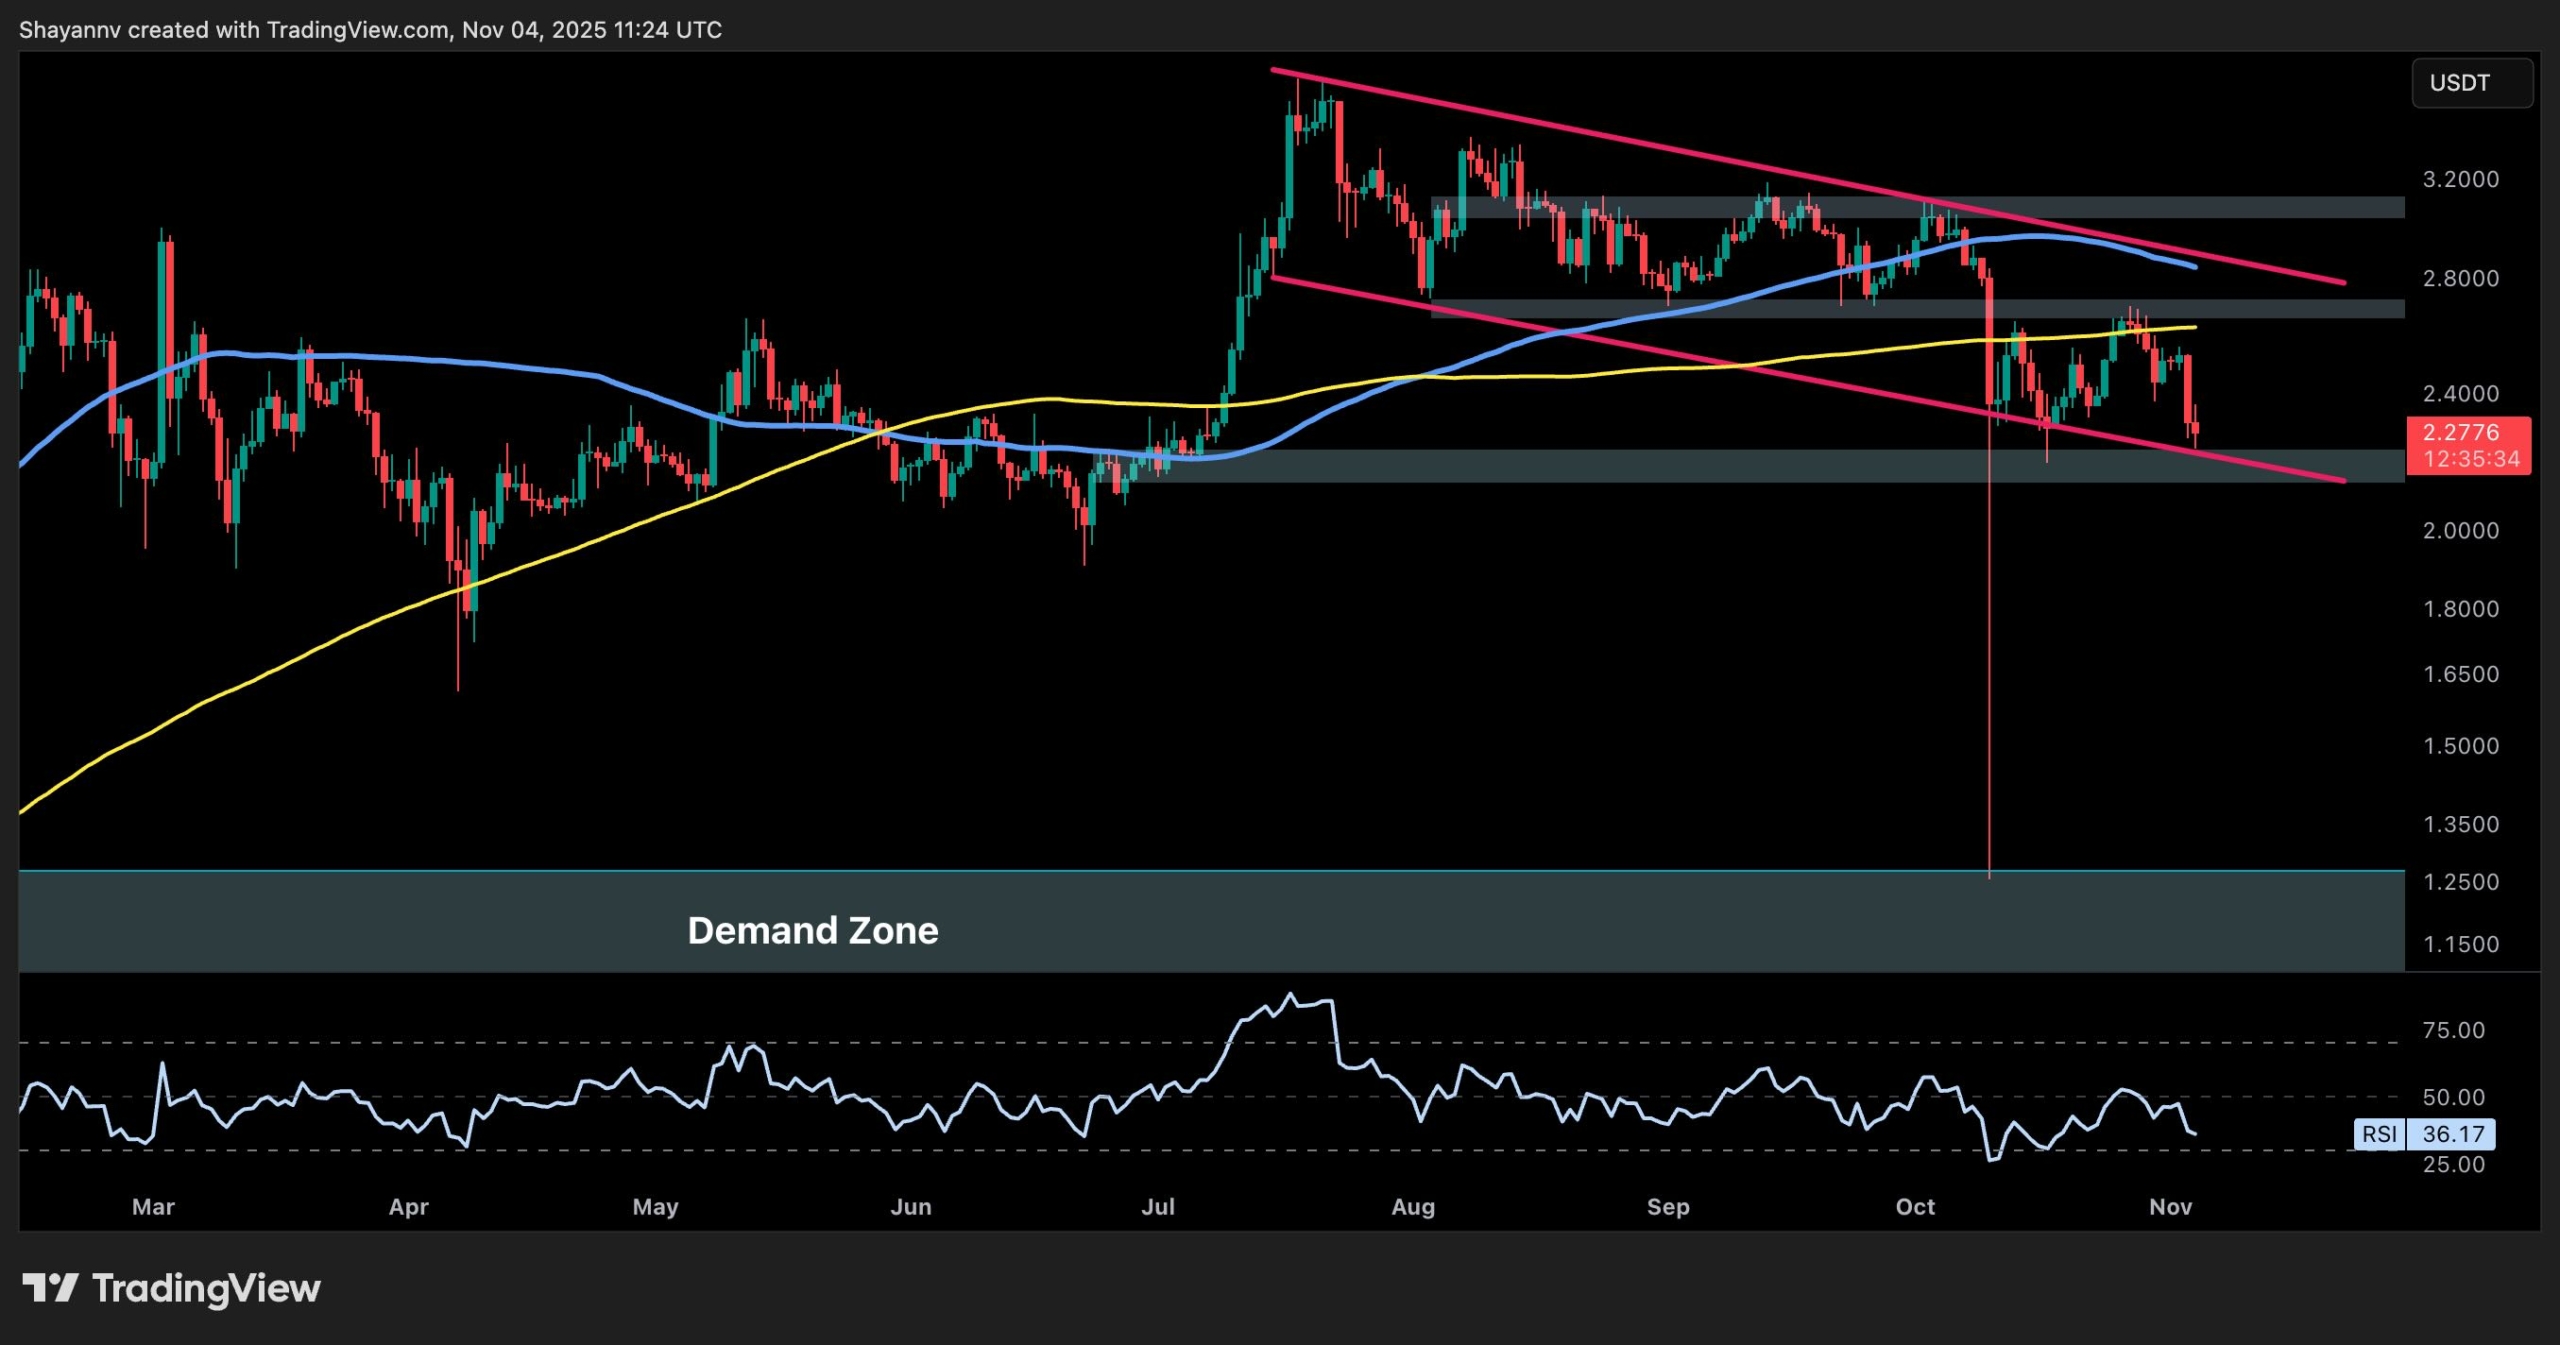
The USDT Pair
On the USDT pair, XRP is on the verge of breaking below the descending channel support and is also testing the demand zone around the $2.20 level. The asset has also been repeatedly rejected by both the 100-day and 200-day moving averages, both of which are located above the price, and is now printing a series of lower highs and lower lows.
Moreover, the RSI is currently at 36, indicating weak momentum and suggesting that there’s still room to the downside before the asset becomes oversold. If this demand zone gives out, the next major support doesn’t appear until closer to the $1.20 range, so buyers will need to show up quickly.
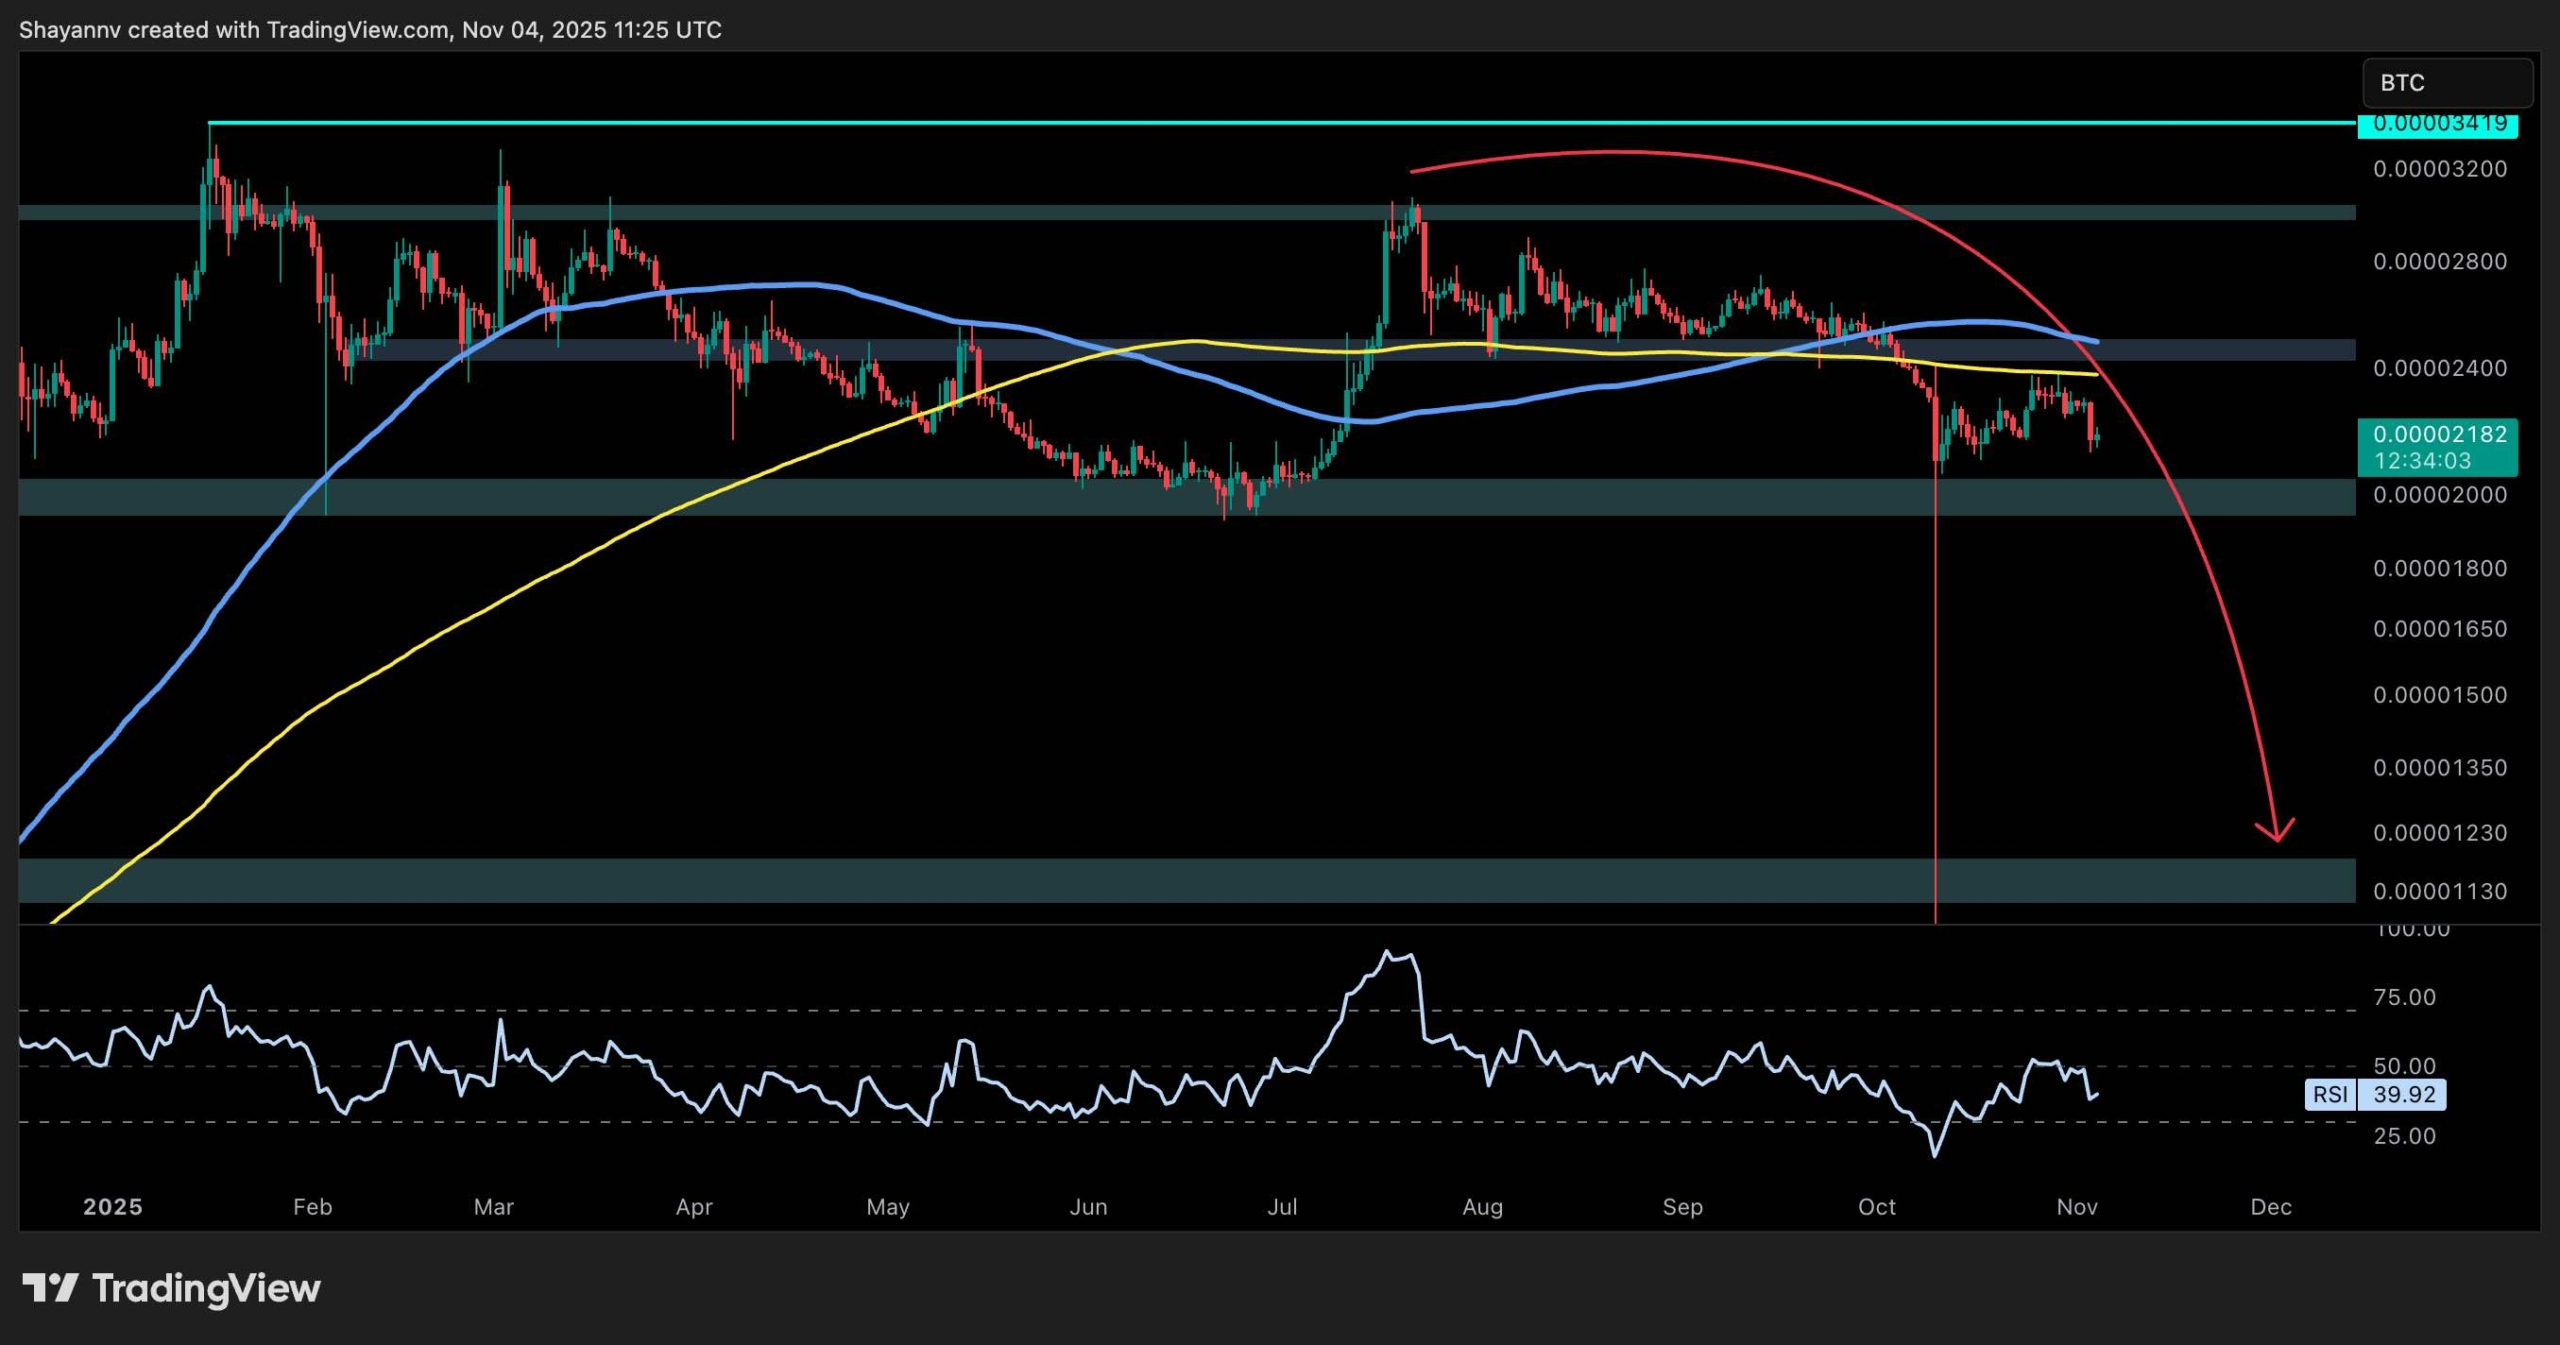
The BTC Pair
On the BTC pair, XRP is hovering just above the 2,100 sats mark, but the structure looks like a clear rounded top. After failing to reclaim the 2,400–2,500 sats resistance zone and losing both 100-day and 200-day moving averages, the pair is now in danger of confirming a broader breakdown.
If the 2,000 sats support zone fails to hold, a rapid flush would be expected, which could push the price lower toward the 1,200 sats demand area. Momentum is also soft here, with the RSI at 39 and trending downward again, reflecting growing weakness relative to Bitcoin.
As a result, the outlook for XRP against both USDT and BTC remains bearish, unless fresh demand emerges and pushes the price back above the key 100-day and 200-day moving averages on both charts.
The post Ripple Price Analysis: What’s Next For XRP Against USD and BTC After a 14% Weekly Decline? appeared first on CryptoPotato.