Ripple’s XRP has staged a sharp rebound after printing a local low near $1.10, but the broader structure remains fragile. The recent impulsive move higher has pushed the price back into a key supply area, creating a critical decision point between continuation and another rejection within the dominant downtrend.
Ripple Price Analysis: The Daily Chart
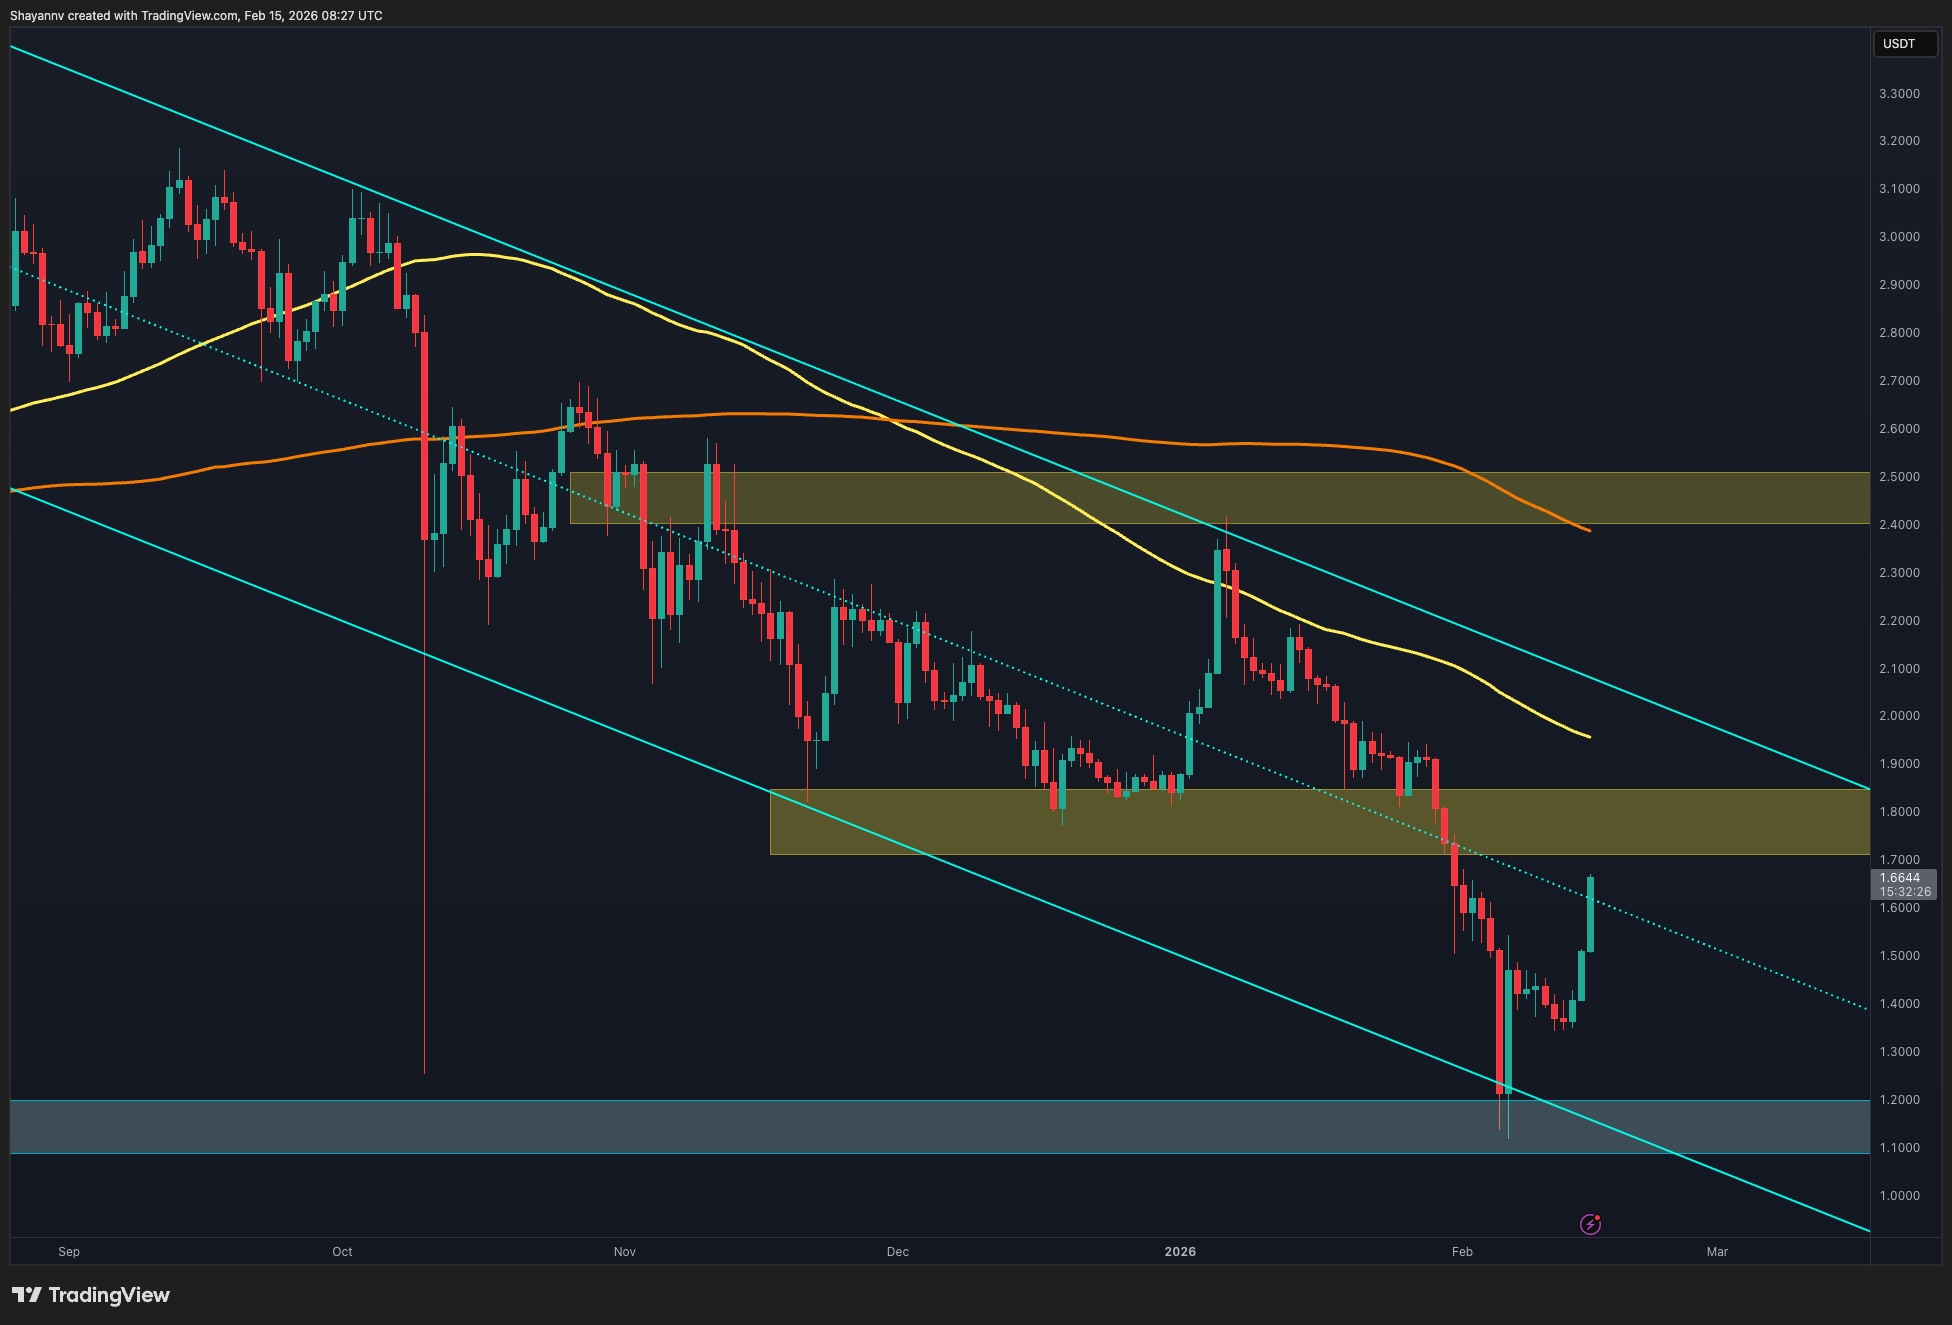
On the daily timeframe, XRP remains inside a well-defined descending channel, respecting the bearish structure despite the recent bounce. The sell-off accelerated toward the major demand zone around $1.10–$1.20, where buyers finally stepped in aggressively. This reaction confirms the significance of the $1.15 area as a strong higher-timeframe demand.
However, the rebound is now approaching the channel’s middle trendline , a prior breakdown region near $1.75–$1.85, which previously acted as support and has now flipped into resistance. As long as the asset remains below this $1.80 region, the broader bias stays corrective within a bearish trend. A daily close above $1.85 would open the path toward the next major supply at $2.40–$2.50, while rejection from this zone could send the price back toward $1.20 again.
XRP/USDT 4-Hour Chart
On the 4-hour timeframe, the recovery appears more impulsive, with strong bullish candles reclaiming the short-term supply area around $1.50–$1.55. The asset pushed into the $1.65–$1.80 region, which aligns with minor intraday supply and the lower boundary of the previous consolidation range. However, it was rejected there and brought back to its starting point.
If RP manages to stabilize above $1.55 and build a base between $1.55 and $1.70, a continuation toward $1.80 becomes likely. On the other hand, failure to hold above $1.55 could shift momentum back to the downside, exposing $1.30 first and then the key $1.15 demand again.

The post Ripple Price Prediction: Is $1 Back in Play After XRP’s Rally Was Halted at $1.65? appeared first on CryptoPotato.